To truly understand the performance of your Sales Team, being able to extrapolate and study conversion metrics is crucial. With that, SPOTIO is excited to announce the release of our new Dashboards.
The first up on this multi-level release are the Conversion Metric Reports (for the second release, Leads Created By Reports, click here). These help you see trends and determine where the sales process is thriving and where it may need some extra attention.
As a Sales Manager, it’s your responsibility to utilize the data from your CRM so you can take a strategic approach and determine how to operate and produce at peak productivity. Sales activities and metrics are a critical component of managing a mobile workforce, and are essential to measuring their success.
SPOTIO’s new Conversion Metric Dashboards give you the insights and analytics you need to asses and tweak the sales process, resulting in a 2x increase in Sales Rep productivity.
Dashboard Types
- Conversion Metrics: Full Pipeline
- Conversion Metrics: First Stage to Won
- Conversion Metrics: Visits to Next Stage (Average Number of Visits)
- Conversion Metrics: Visits to Next Stage (Total Efforts)
Conversion Metrics: Full Pipeline
Benefit
Keep the sales engine running and reps on track by quickly identifying where deals are being lost.
Feature
This graph shows the number of leads created during a given timeframe distributed by their current stage. Active leads are in yellow and Lost leads in red. The Lost leads are distributed into the stages they were in before they were moved to Lost.
The percentages show the number of Lost leads for the associated stage.
Insight
See where the largest percentage of leads are Lost or Active by stage. Helps the user understand at which stage the bulk of their business is being Lost.

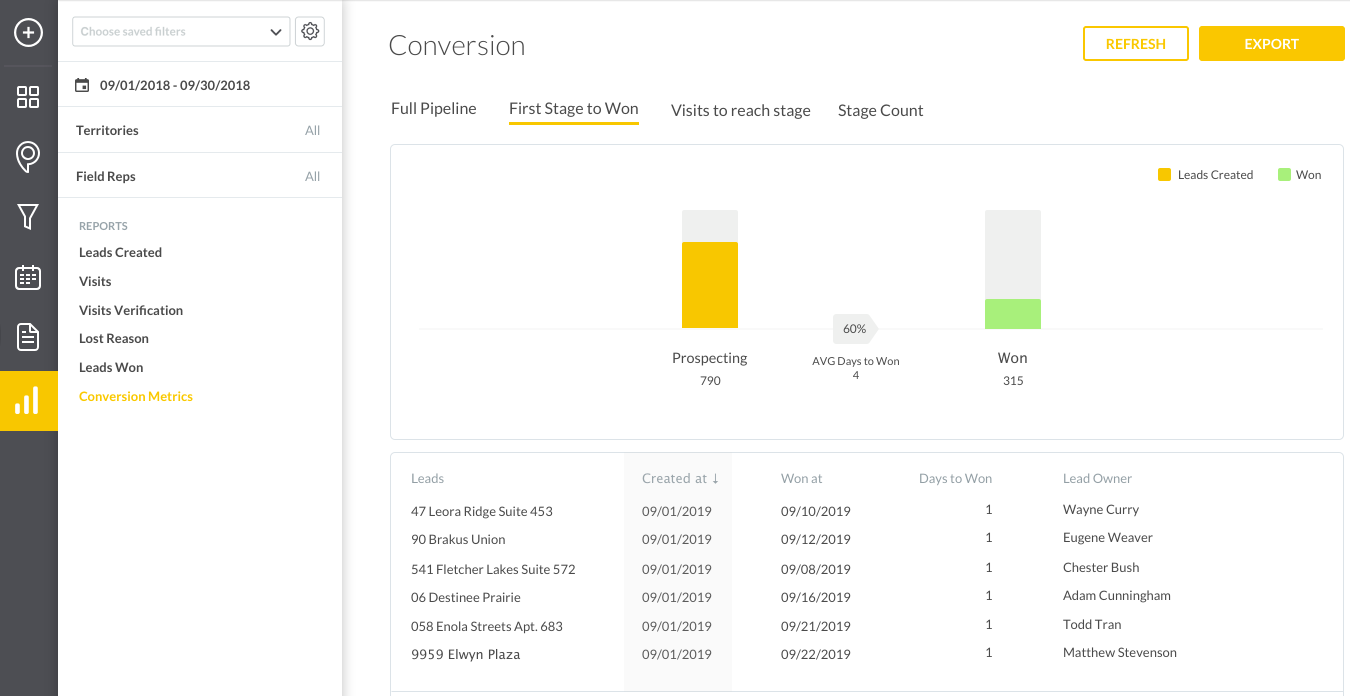
Conversion Metrics: First Stage to Won
Benefit
How nice would it be to easily know which reps are performing and which need some attention? With this report, you will!
Feature
See the % of leads that do – or do not – make it from Prospecting (first stage) to Won. Additionally, First Stage to Win illustrates the average number of days from Prospecting (first stage) to Won.
Insight
This report provides an overall sense of how quickly reps are converting initial Opportunities to Wins, as well as the total number of how many Wins Reps are getting relative to overall first stage leads.
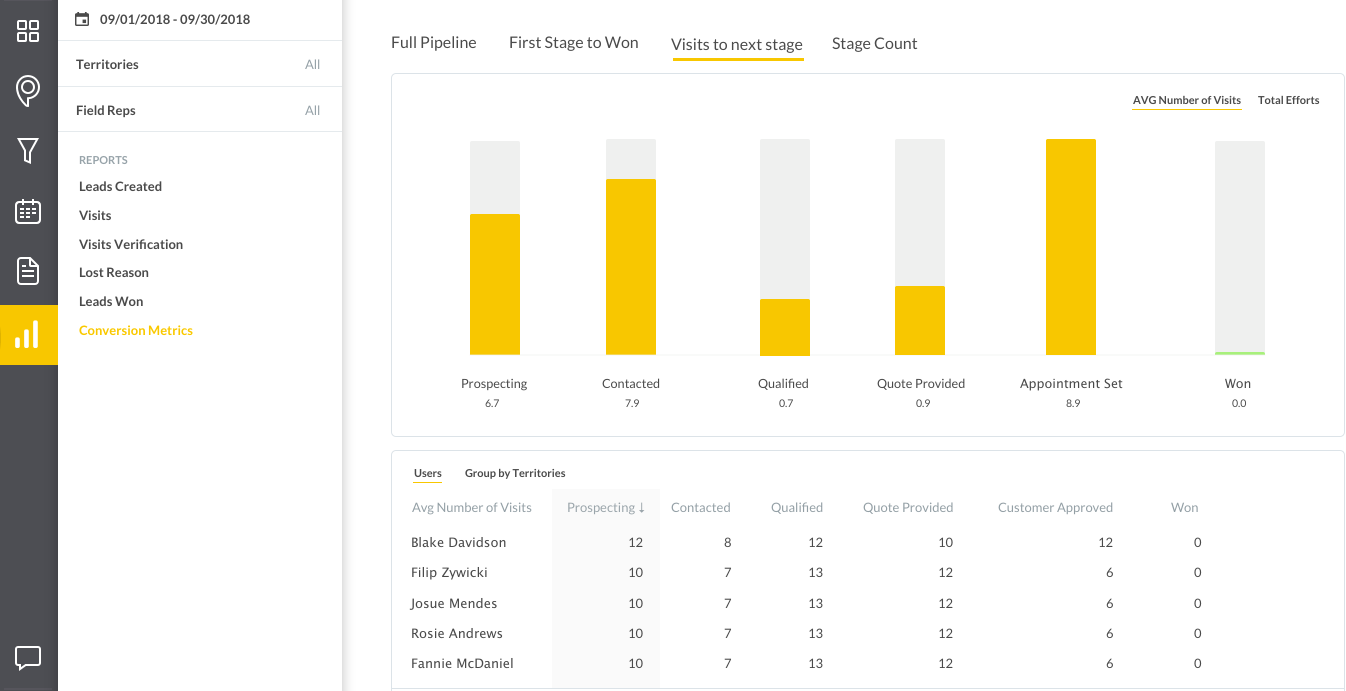
Conversion Metrics: Visits to Next Stage (Average Number of Visits)
Benefit
Gives reps the power of efficiency by showing how much attention and contact each prospect needs. This will greatly streamline a reps day and increasing chances of a win.
Feature
This reports shows the number of visits that Sales Reps should do to achieve next stage. Average number of visits mode: shows absolute number of visits logged on each stage. As result user able to see what stage requires more visits.
On the screen we can see that Sales Rep should do dozens of visits to move from Prospecting to Qualified and Appointment Set to Won, but moving from Quote Provided to Appointment Set usually not requires visits.
Insight
Gives user a sense of which stage requires the most visits and attention from the reps and overall sense of where resources are committed most heavily toward the sales effort.
Conversion Metrics: Visits to Next Stage (Total Efforts)
Benefit
Did you know that an unmotivated Sales Rep can result in a 25% – 50% loss in productivity? A great way to keep your sales team motivated and hungry is through our ‘Total Efforts’ report.
Feature
This Report shows the number of visits that Sales Reps should do to in order to keep the sale moving in the right direction. Total Efforts mode: shows total number of visits that were logged.
Insight
Visits to Next Stage is an alternative way to show dynamics of the Visits and visualize the number of visits from Stage 1 to Stage 2, Stage 1 to Stage 3, etc.

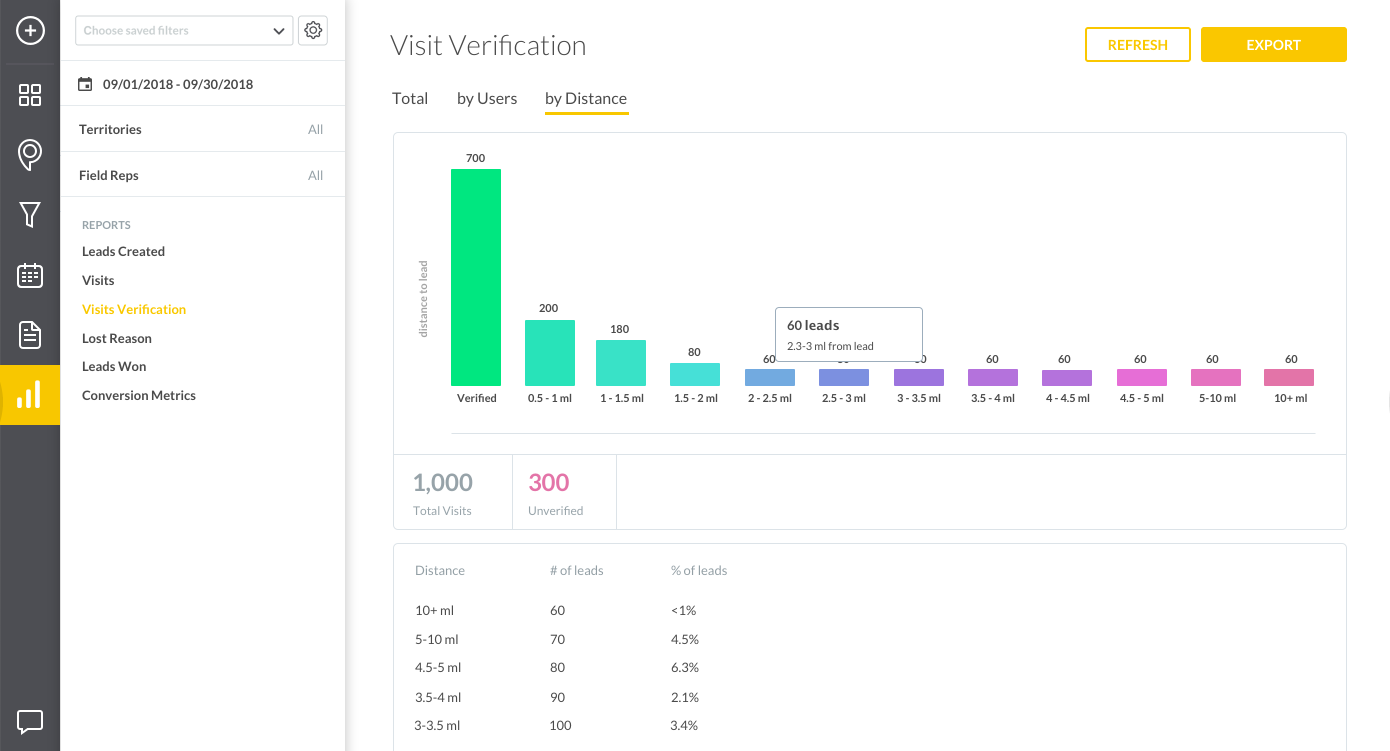
Visit Verification: by Distance
Benefit
Sometimes there is mistrust with Sales Reps. One way to ensure they’re working the territories they claim is through Visit Verification Reports to put your mind at ease.
Feature
This Report shows average distance the Sales Rep is from the prospect when they create a lead while out in the field.
Insight
See the number of leads your Reps are creating and the distance from the lead they are when they are creating it.
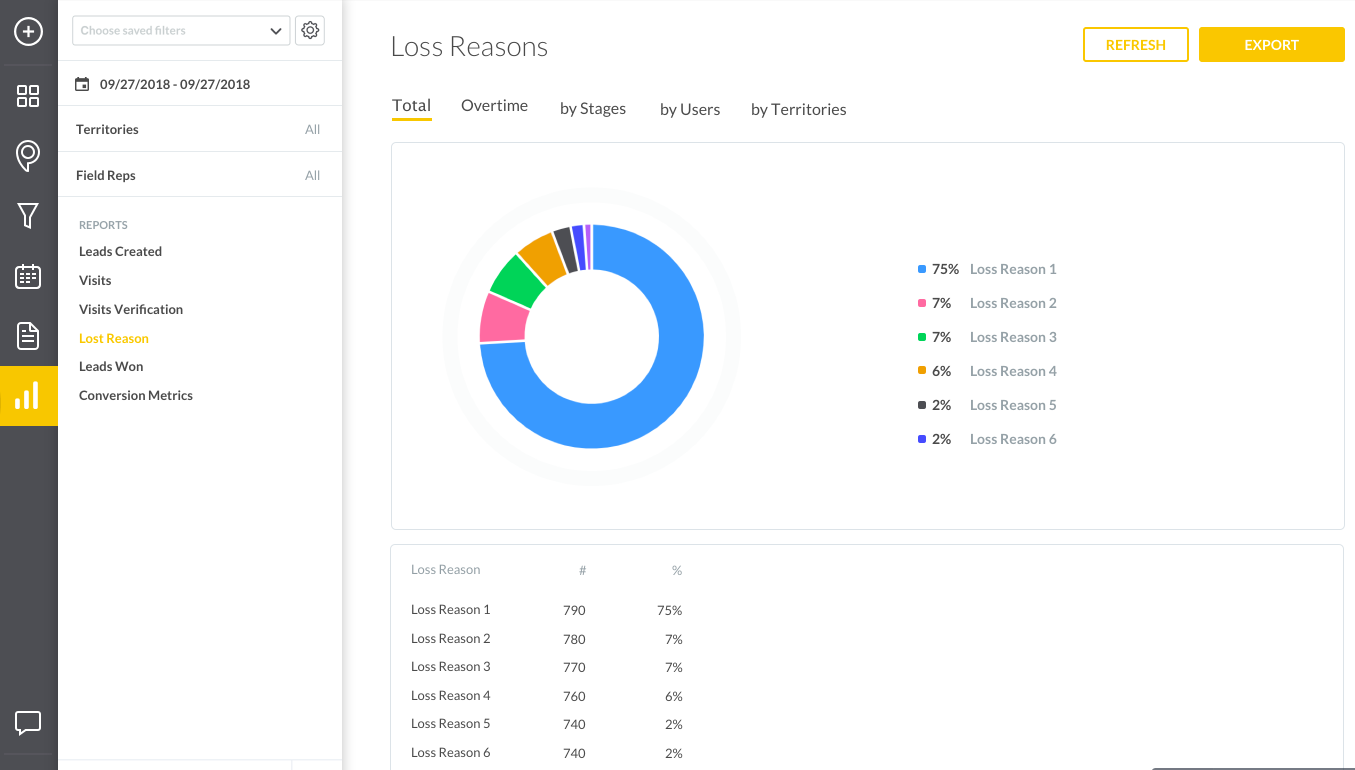
Loss Reasons
Benefit
Being able to pull reports based on reasons why a lead ended as a ‘loss’ will help Sales Reps – and Managers – determine what went wrong and possible mistakes made so that you can prevent losses in the future.
Feature
This Report shows the number of visits that Sales Reps should do to in order to keep the sale moving in the right direction. Total Efforts mode: shows total number of visits that were logged.
Insight
This report provides insight into why leads were lost organized by category.
It’s not enough to simply know the numbers, you have to understand what they’re telling you. It’s important to have the ability to interpret where a rep on your team could be experiencing success, or struggling, simply from looking at the numbers.
________
Questions or comments? Contact SPOTIO at [email protected] or comment below.
SPOTIO is the #1 field sales acceleration and performance management software that will increase revenue, maximize profitability, and boost sales productivity.
Want to see a product demonstration? Click here to see how SPOTIO can take your sales game to the next level.