To truly understand the performance of your Sales Team, being able to extrapolate and study conversion metrics is crucial. With that, SPOTIO is excited to announce the release of our new Dashboards.
The second up on this multi-level release are the Leads Created By Reports (for the first release, Conversion Metric Reports, click here). These help you see trends and determine where the sales process is thriving and where it may need some extra attention.
As a Sales Manager, it’s your responsibility to utilize the data from your CRM so you can take a strategic approach and determine how to operate and produce at peak productivity. Sales activities and metrics are a critical component of managing a mobile workforce, and are essential to measuring their success.
SPOTIO’s new Leads Created Dashboards give you the insights and analytics you need to asses and tweak the sales process, resulting in a 2x increase in Sales Rep productivity.
Dashboard Report Types
-
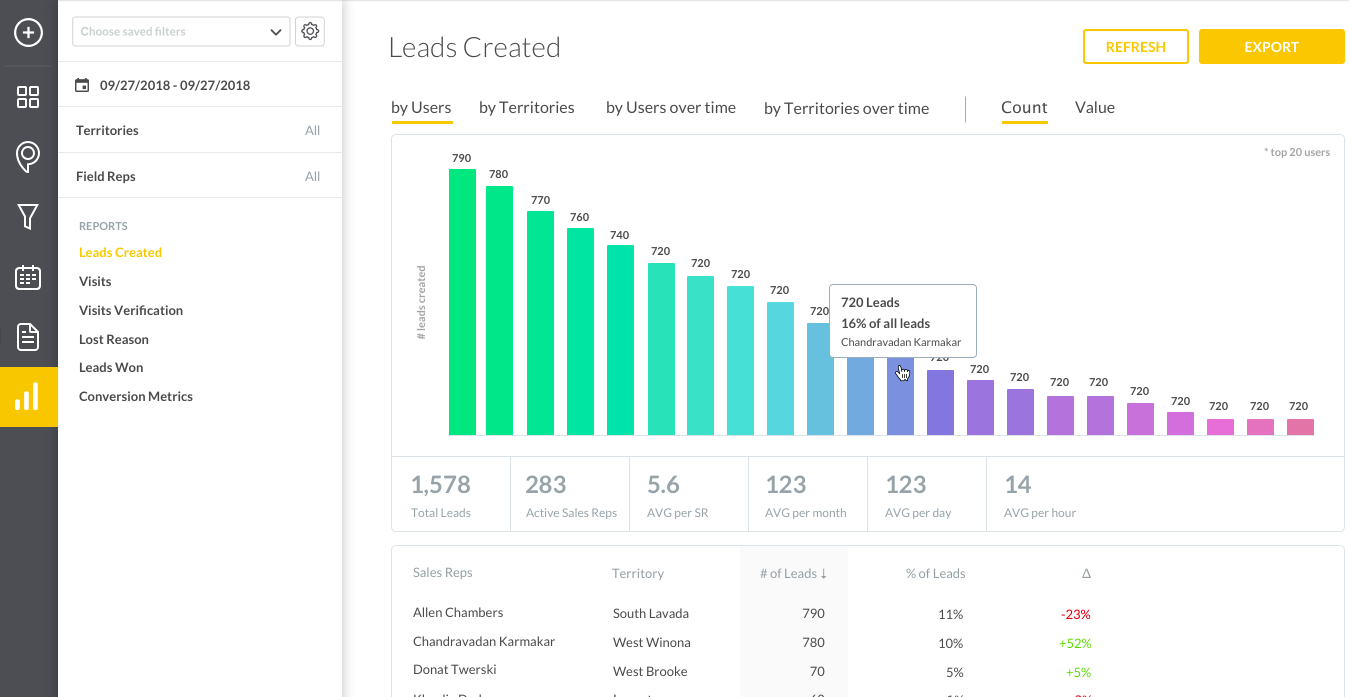
Leads Created: Users Shown by Count
Benefit
Who are your best reps? This report will show you.Feature
See the number of leads, the % of the total, total leads, active Sales Reps, average leads per month and average per hour.Insight
With this dashboard, you’ll gain perspective of the total effectiveness of each Sales Rep measured by number of leads and broken into dimensions over time.
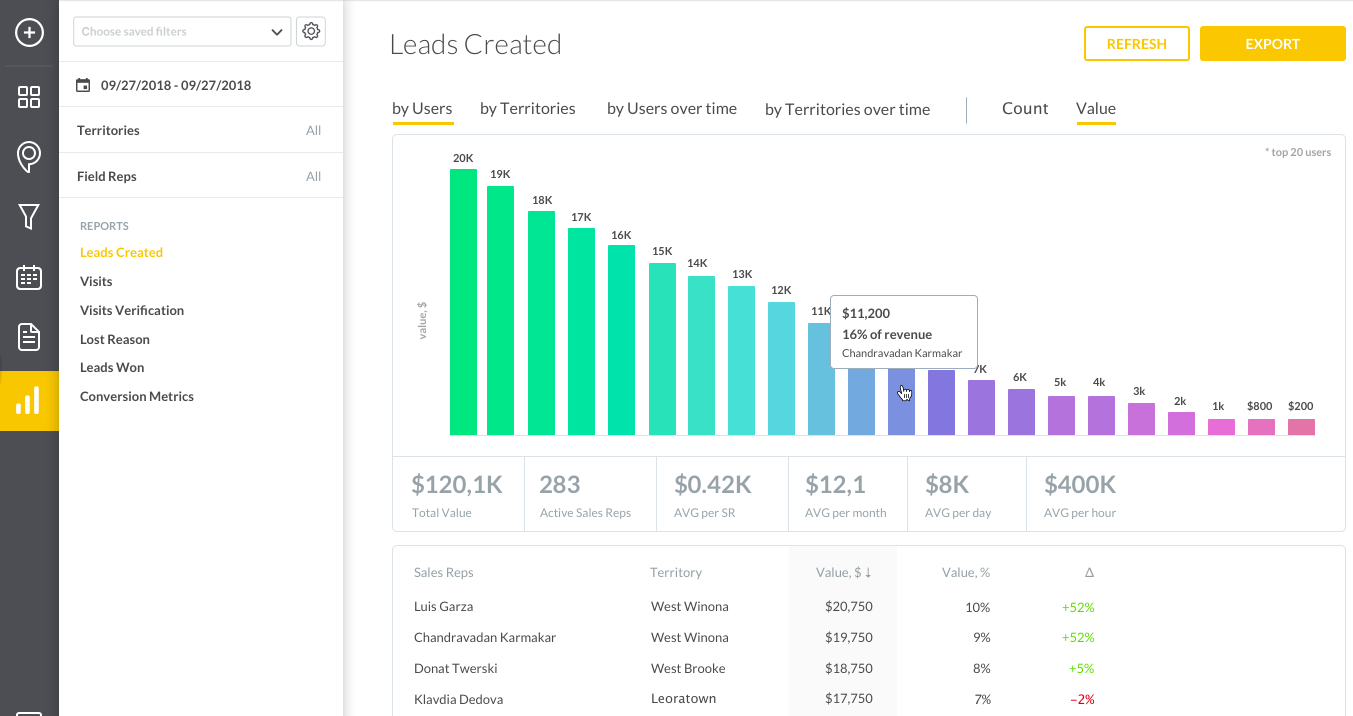
Leads Created: Users Shown by Value
Benefit
Know the total value of leads that each Rep is working and better forecast sales based on their current lead volume.Feature
This report shows the total value of leads, the % of the total, total number of leads, the active Sales Reps, average value per month and average per hour.Insight
Pulling reports by value provides a perspective of the total effectiveness of the individual Sales Reps measured by the revenue value of the leads and broken into dimensions over time.
Leads Created: Shown by Count Over Time
Benefit
Easily dial into user performance on a daily, weekly, or monthly basis.Feature
This report shows a line chart based on the number of created leads or total count by users. Note: only the top 5 users are represented on the chart.Insight
Table view shows a complete list of users and the number of visits or total count based on timeframe:– If timeframe more than month, graph shows by month
– If timeframe less than a month, graph shows by day
– If timeframe is one day, graph shows by hour
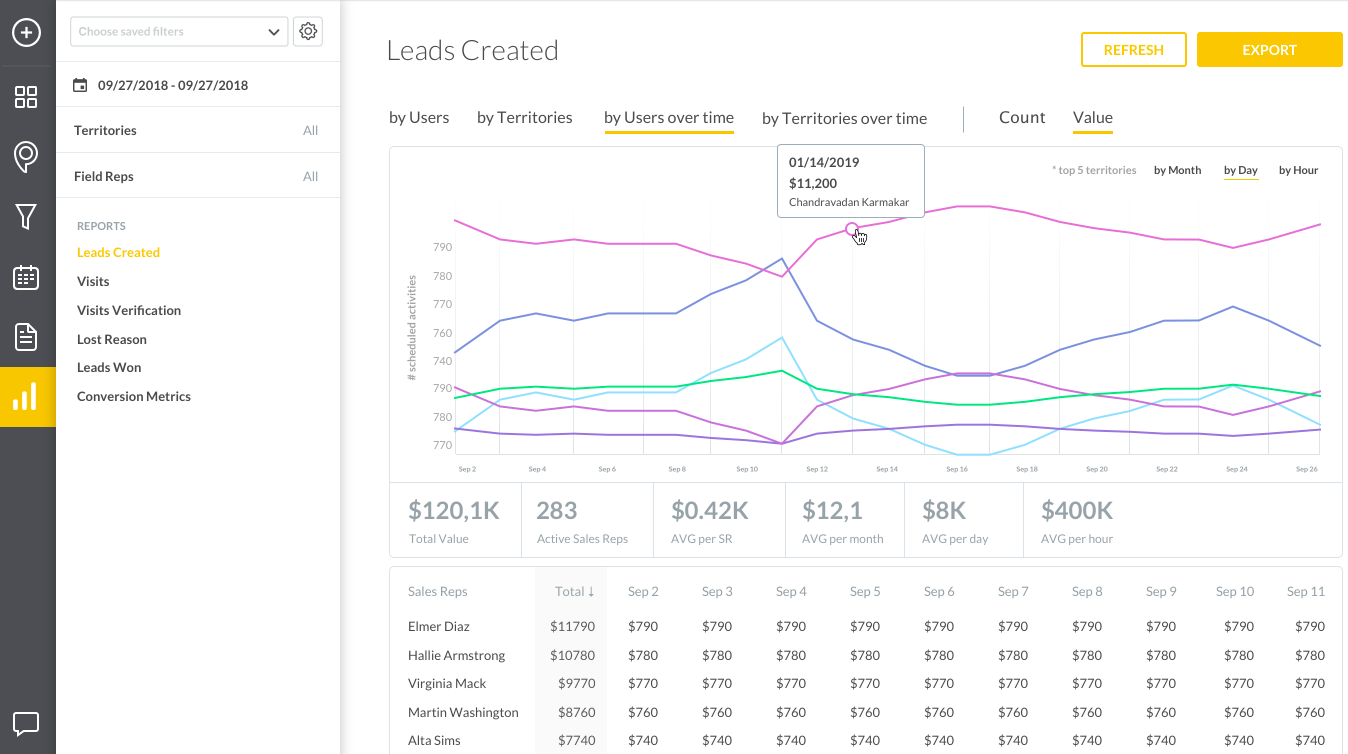
Leads Created: Shown by Value Over Time
Benefit
Easily extrapolate and view number of visits or value of each lead on a daily, weekly, or monthly value.Feature
This graph displays a line chart based on the number of created leads or total value of leads by user. Note: only the top 5 users are represented on this chart.Insight
Table view shows full list of users and the number of visits or total value based on three potential timeframes:– If timeframe is longer than a month, graph shows by month
– If timeframe less than a month, graph shows by day
– If timeframe is one day, graph shows by hour
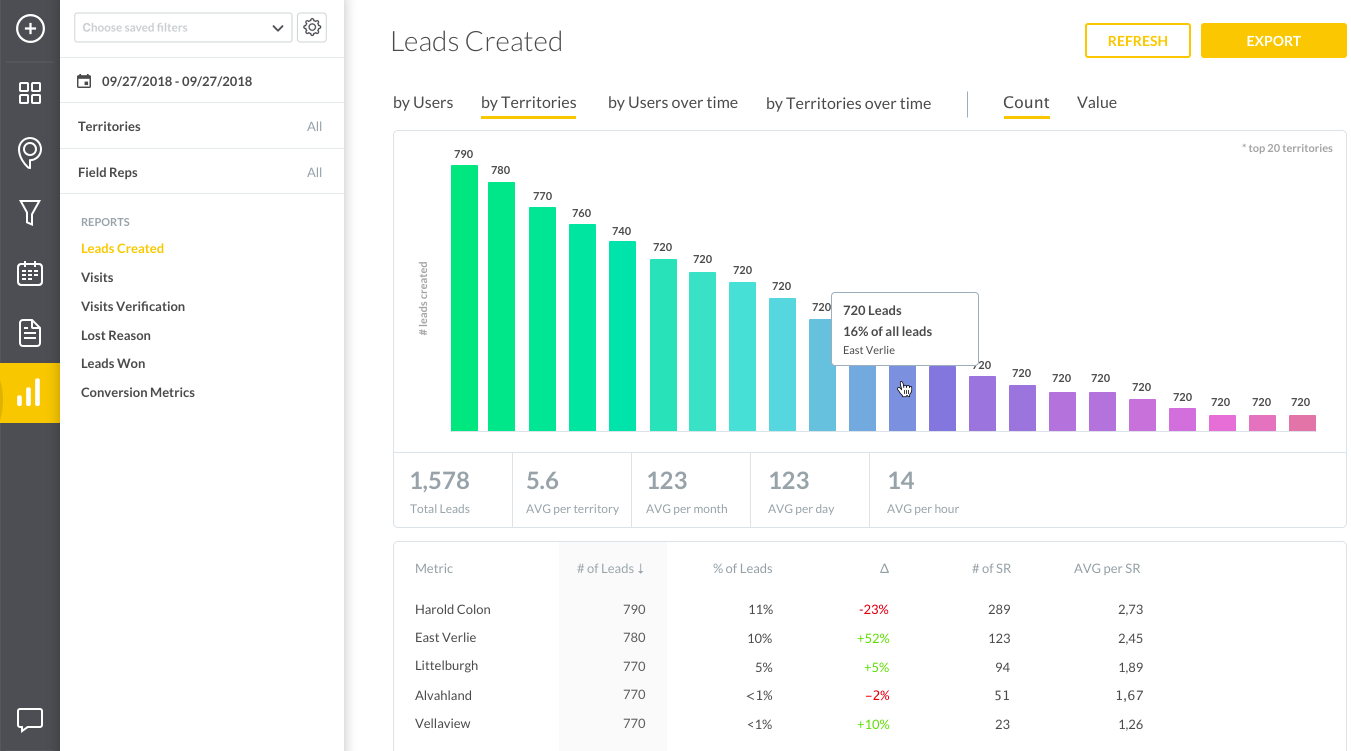
Leads Created by Territories: Shown by Count in a Snapshot View
Benefit
Make Sales Reps more productive and successful by showing them which territories are the most fruitful.Feature
A snapshot graph to show the number (amount) of leads created in each territory.Insight
Gives Sales Reps insight into which territories represent the largest opportunity in terms of total number of leads.
Leads Created by Territories: Shown by Value in a Snapshot View
Benefit
Make Sales Reps more productive and successful by showing them which territories are the most valuable in terms of potential deal size.Feature
A snapshot graph to show users the value of leads created in each territory.Insight
Offers insight into which territories represent the largest opportunity in terms of overall dollar value.
It’s not enough to simply know the numbers, you have to understand what they’re telling you. It’s important to have the ability to interpret where a rep on your team could be experiencing success, or struggling, simply from looking at the numbers.
_____
Questions or comments? Contact SPOTIO at [email protected] or comment below.
SPOTIO is the #1 field sales acceleration and performance management software that will increase revenue, maximize profitability, and boost sales productivity.
Want to see a product demonstration? Click here to see how SPOTIO can take your sales game to the next level.