

You already know your team needs activity reports. The harder question is which metrics belong in each one — and which cadence actually surfaces problems early enough to fix them.
Get this wrong and you end up with two bad outcomes: managers drowning in dashboards that don’t tell them anything, or reps logging data into a void because nobody acts on it. Get it right and your reporting cadence becomes a coaching system — daily effort feeds weekly momentum, weekly momentum builds monthly results, and you can see exactly where the chain breaks.
This guide breaks down the specific metrics field sales leaders should track at each reporting cadence, explains why each one matters for teams working in the field, and shows how to connect them into a system that drives decisions, not just documentation.
Why Sales Activity Reports Matter for Field Teams
Every sales organization tracks something. The difference between teams that hit quota and teams that don’t often comes down to what they track and when they look at it.
SPOTIO’s 2026 State of Field Sales survey found that field reps spend just 43% of their time on actual selling activities — in-person visits and phone or virtual meetings combined. The other 57% goes to admin tasks, data entry, planning, prep, and internal meetings. That’s more than half the workweek spent off the front line.
For field and outside sales teams specifically, the visibility gap compounds the problem. Inside sales managers can walk the floor and listen to calls. Field sales managers are managing blind unless activity data flows back in a structured, timely way. That’s what a well-built reporting cadence gives you: the ability to see effort, momentum, and results on a rhythm that lets you intervene before small problems become missed quarters.
The key distinction is between leading indicators (activities your reps control today) and lagging indicators (outcomes you can measure after the fact). Daily reports lean heavily on leading indicators. Monthly reports capture lagging indicators. Weekly reports are where the two connect — and where the best coaching conversations happen. For a deeper look at what to track and how to set up the tracking system itself, see our sales activity tracking guide.
Daily Sales Reports
Daily reports answer one question: are reps putting in the right effort, in the right places?
These are pure leading indicators. None of them tell you whether revenue is growing, but all of them predict whether it will.
Visits and In-Person Contacts
For field teams, this is the foundational activity metric. How many customer or prospect locations did each rep visit today? How many of those visits resulted in a face-to-face conversation?
Visit volume is the single strongest predictor of pipeline generation in field sales. A rep who consistently completes eight to twelve visits a day is doing fundamentally different work than one completing three — and the pipeline will reflect it within weeks. Track both total visits and contact rate (the percentage of visits where the rep actually spoke with someone). A high visit count with a low contact rate may signal poor territory planning or visit timing rather than low effort.
Outreach Volume
Field reps don’t just knock doors — they call, email, and text between stops. Track total contact attempts across all channels each day. The number matters less in isolation than it does in trend: a rep whose daily outreach drops 40% mid-week is telling you something.
This is also where follow-up sequences become visible. Reps using a structured outreach cadence should show consistent daily volume. Inconsistency usually means the sequence isn’t being followed.
New Prospects Added
How many new records did the rep create from the field today? This metric tracks whether reps are building pipeline or just working existing leads.
For B2C residential teams using SPOTIO’s Lead Machine, reps can search for new prospects using 15 data points — income level, home value, credit capacity, and more — to qualify neighborhoods before they knock. For B2B teams, SPOTIO pulls business info from Google Places, giving reps prospect data they can act on between stops.
Follow-Up Completion Rate
This is the metric most daily reports miss. It’s not enough to know how many follow-ups a rep attempted — you need to know what percentage of scheduled follow-ups actually happened.
If a rep has 10 follow-ups scheduled and completes 6, that’s a 60% completion rate. The four that didn’t happen represent warm leads going cold. Track this daily and you’ll spot process breakdowns — overloaded routes, poor time management, or unrealistic follow-up cadences — before they cost you deals.
Weekly Sales Reports
Weekly reports shift from effort to momentum. You’re looking at whether daily activity is actually producing pipeline movement.
Meetings Booked and Show Rate
This is the conversion layer between outreach and opportunity. How many meetings did reps book this week, and what percentage of those meetings actually happened?
First-meeting show rate is an underrated coaching signal. A rep with a strong booking rate but poor show rate may have a confirmation process problem, a qualifying problem, or a territory problem where prospects are less committed. Track both numbers together — bookings alone are misleading.
Lead-to-Opportunity Conversion
Of the leads your reps worked this week, how many moved to qualified opportunity status? This metric connects top-of-funnel activity to pipeline.
The formula is simple: qualified opportunities created ÷ total leads worked = conversion rate. Compare this across reps and territories to spot performance variance. A rep converting at 15% while the team averages 25% needs a different conversation than a rep who’s converting well but not working enough leads.
Pipeline Created
Track the dollar value of new pipeline generated from field activity each week. This is where effort turns into money — or doesn’t.
Break this down by territory to identify imbalances. If one territory generates 3x the pipeline of another with similar rep effort, that’s a territory allocation signal, not a rep performance signal. Weekly pipeline creation by territory is one of the most actionable metrics in any sales territory plan.
Proposals and Quotes Sent
Proposals sent is a strong leading indicator of deals approaching close. A week with high activity but zero proposals tells a different story than a week with moderate activity and five proposals out the door.
If this number consistently lags, look upstream: are reps getting to the proposal stage and stalling, or are they not reaching it at all? The weekly view gives you enough signal to diagnose without overreacting to daily noise.
Monthly Sales Reports
Monthly reports answer the only question leadership ultimately cares about: are we winning?
These are lagging indicators — outcomes produced by the daily and weekly activity that preceded them. The monthly report is where you connect the full chain.
Win Rate and Close Rate
Win rate is closed-won deals divided by total opportunities. This is your team’s batting average, and it’s the first metric most VPs ask about.
Segment it by rep to identify coaching needs versus process problems. If one rep’s win rate is half the team average, the weekly reports should tell you exactly where deals are dying — pair this with your pipeline reporting to see which stage is the bottleneck. If the entire team’s win rate is declining, the problem is upstream — lead quality, territory assignment, or competitive pressure.
Average Deal Size and Revenue by Territory
Average deal size tells you whether reps are selling the full solution or closing minimum deals. Revenue by territory tells you where your most valuable markets are.
Just one in three field sales teams report that 70% or more of their reps consistently hit quota. Monthly territory revenue views are how you catch slippage early — before a struggling territory quietly drags down the whole team’s number. Pair this with territory management tools to visualize revenue concentration and coverage gaps on a map.
Pipeline Value by Stage
Where is your money sitting? A pipeline with heavy value at the top and almost nothing in late stages means deals aren’t progressing. A pipeline with all the value in late stages and nothing new entering means next quarter is in trouble.
Look for bottlenecks — stages where deal value accumulates but doesn’t move. Those bottlenecks are your highest-leverage coaching opportunities.
Percentage of Monthly Goal
This is the north star metric: cumulative revenue against the monthly target. The formula is straightforward — month-to-date closed revenue ÷ monthly goal = percentage of goal — but the value comes from tracking it weekly throughout the month.
A team at 40% of goal on the 15th is on track. A team at 20% on the 15th has a problem that should have been visible in the weekly reports two weeks ago.
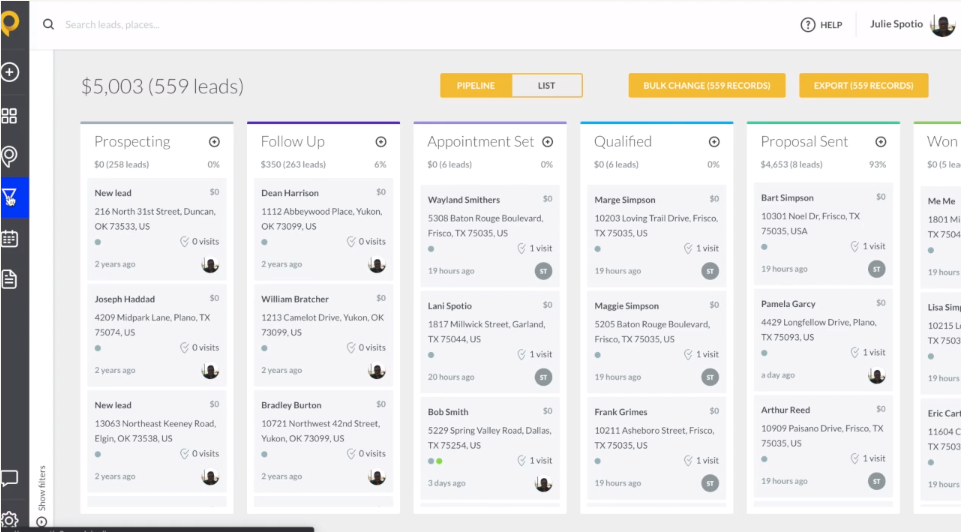
SPOTIO Pipeline Report
How to Build a Field Sales Activity Report
Choose Metrics by Cadence and Role
Not everyone needs the same report. Reps need a daily view of their own activity against targets. Managers need a weekly view of rep performance and territory momentum. VPs need a monthly view of pipeline health and revenue trajectory.
A useful framework: daily = effort, weekly = momentum, monthly = results. Pick three to five metrics at each cadence and resist the urge to add more until those are consistently tracked and acted on.
Set Benchmarks Before You Track
Tracking without baselines leads to dashboard fatigue. Before you roll out any report, establish what “good” looks like for each metric based on your team’s historical data.
If you don’t have historical data, start with a 30-day baseline period. Track the metrics, don’t act on them, and use the output to set realistic thresholds. Teams that skip this step end up with arbitrary targets that reps ignore.
Use the Right Tool
Building activity reports in spreadsheets works until it doesn’t — usually around rep five or territory three. SPOTIO’s My Reports feature lets managers build custom dashboards by selecting the specific activity metrics and KPIs that matter to their cadence. Reps record activities with one-tap or AI-assisted logging from the field, activity data syncs to the dashboard, and managers review it on their schedule without exporting anything.
The reports pull from the same activity data that feeds your CRM through SPOTIO’s two-way sync — so the numbers managers see in their weekly review match what leadership sees in Salesforce or HubSpot.
Frequently Asked Questions
A sales activity report is a structured summary of the actions your sales team takes — visits, calls, emails, meetings, follow-ups — over a specific time period. It connects rep behavior to pipeline and revenue outcomes, giving managers the visibility to coach effectively and allocate resources based on data rather than gut feel.
An activity report tracks what reps are doing — the effort going in. A pipeline report tracks what that effort is producing — deals at each stage, their value, and their likelihood to close. You need both: activity reports explain why your pipeline looks the way it does.
Daily reports should be reviewed daily — they’re quick pulse checks on effort. Weekly reports deserve a dedicated 30-minute review per team, ideally tied to a coaching conversation. Monthly reports feed leadership reviews and strategic territory decisions. The cadence should match the speed of your sales cycle.
For field teams, start with field visits completed, contact rate (conversations per visit), total outreach attempts across channels, new prospects added, and follow-up completion rate. These five metrics cover effort, territory coverage, and process discipline without overwhelming reps with logging requirements.
Reduce the friction. If logging an activity takes more than a few seconds, completion rates will drop. Tools with one-tap logging and voice input with tap confirmation — like SPOTIO’s DASH — make it possible for reps to capture activities between stops without breaking their workflow. Pair that with showing reps how the data is used for coaching and territory decisions, not surveillance. For a deeper dive into the friction points that kill CRM adoption and a week-by-week rollout plan, see our field sales CRM adoption playbook.
Start Turning Activity Data Into Coaching Decisions
The gap between teams that consistently hit quota and teams that don’t isn’t usually effort — it’s visibility. Activity reports built on the right metrics, reviewed at the right cadence, give field sales managers the signal they need to coach earlier, allocate smarter, and catch problems while there’s still time to fix them.
SPOTIO gives field sales teams the activity tracking, custom reporting, and territory visibility to make that happen — with one-tap logging that reps actually use and dashboards that managers actually review. Get a personalized demo to see how it works for teams like yours.

Trey Gibson is the founder and CEO of SPOTIO, where he helps sales leaders build more efficient, high-performing field sales teams. With a background in entrepreneurship and as the founder of a roofing company, Trey brings hands-on experience leading door-to-door and B2B sales organizations. He combines real-world sales leadership with a passion for technology and operational efficiency to help teams scale, perform, and win more deals.
Research and drafting assisted by AI tools; all content is reviewed, fact-checked, and approved by Trey and the SPOTIO editorial team.