Key Sections:
On the surface, selling seems simple. Your sales team just needs to talk to prospects about their problems and your solutions. However, as a sales manager you know it’s not so cut and dry.
There’s a little more management and organization that goes into having an effective and efficient field sales team. That’s where the sales operations team comes in.
While your sales is focused on direct customer interaction, your sales operations team must keep the sales machine moving forward. If outside sales reps are your boots on the ground, the sales operations team are your eyes in the sky.
Choosing the Right Metrics
Part of the job of your sales operations team is to track and communicate metrics. These sales operations metrics should keep tabs on the entire sales process, starting all the way back at employee hiring and training.
Sales Team Metrics
Training
Keep track of how many training sessions the sales team attends each month. After all, they’re your product experts and need to be up to date on the latest product updates. Then, check back throughout the year to find the percent still applying training six months out.
Training is a worthwhile investment, granted it’s being implemented. For an outside sales rep in the field, it’s easy to forget what was taught in product training. Providing field sales reps with a digital version of spec sheets and marketing slicks to view on their mobile device will go a long towards training retention.
Continuous training gives 50% higher net sales per employee.
Don’t forget to monitor the portion of reps following the sales process from the handbook. Continuously reviewing best practices makes the entire team work as a consistent and powerful sales machine.
Employee Retention
Keeping track of your turnover and hire rates helps your team prepare for the future. The average turnover rate for sales reps is around 25%, but you should aim for closer to 10%. Some turnover is natural, but losing top talent or large portions of your team each year will keep you from reaching quota.
Keeping track of the percentage that accepts employment offers will also give insight into how attractive your company is to an outsider.
Relationship with CRM
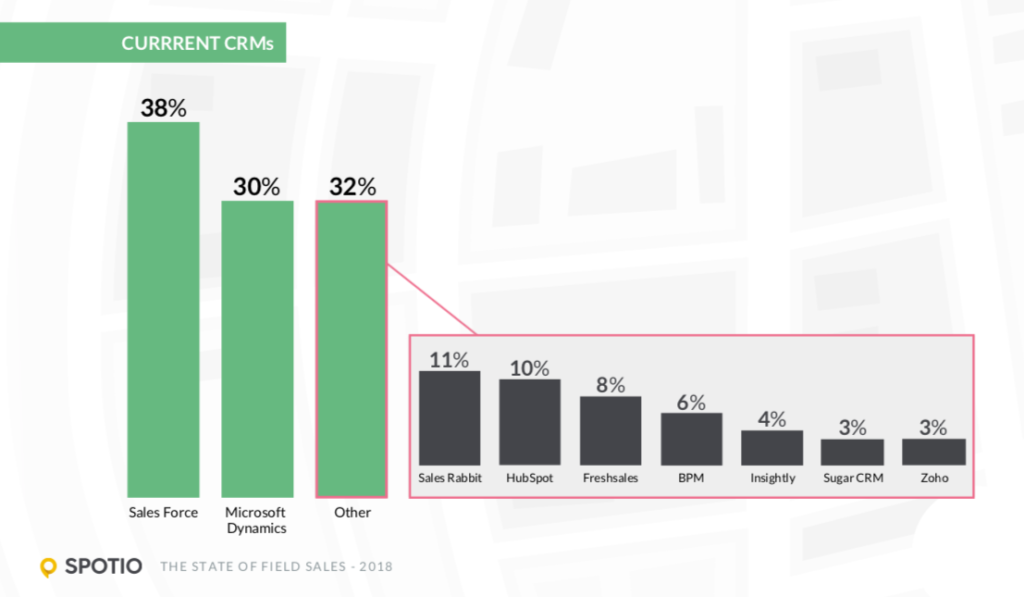
The sales operations team are the pilots of the CRM. Their first task is to make sure sales rep actually use the tools available since only around 40% of businesses have a strong CRM adoption rate. Record the average time spent selling vs. on overhead tasks.
Having sales reps document the percentage of time spent on manual data entry can also reveal inefficiencies in daily tasks. Complex and unintuitive mobile functionality of heavy hitters, like Salesforce and Microsoft Dynamics, make it difficult for outside sales reps to input data in the field.
CRM adoption will skyrocket if your team of reps has access to a CRM that is easy and efficient to use while out and about.
Process & Procedure Metrics
Achieving and surpassing sales goals starts with the team’s everyday tasks, but management will also want to see results.
Win Rate
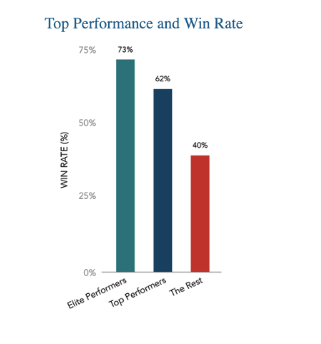
This is a non-negotiable metric. If you don’t know what percentage of leads turn into a sale and what the average deal is worth (customer acquisition cost), then forecasting will be impossible. The type of sales quota you choose for your team may vary, but it needs to exist in your reporting in some manner.
The RAIN Group Center for Sales Research found that the 33%, but this metric will obviously vary across team, company, and industry.
47% is a starting benchmark to measure yourself on. To calculate the win rate:
Total Number of Sales Closed / Total Amount of Opportunities = Opportunity Win Rate
Once you’ve calculated your current win rate, it’s important to track your average win rate over time. Perhaps your goal is to create a team of elite performers that the RAIN Group’s research found represented 7% of sales teams. These “best of the best” sales reps consistently pull win rates in excess of 70%.
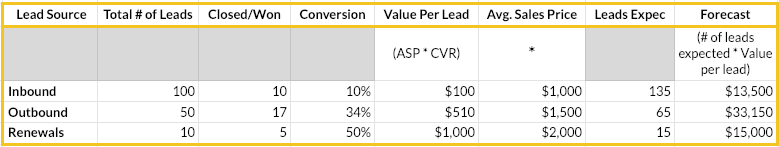
Average Sales Price
Another metric needed to understand sales process effectiveness is the average sales price or deal value. Want to take your awareness even further? Calculate the average sales price by lead source, shown in the table below. When you know not only your average deal size, but also where your most profitable leads come from, your sales team can focus efforts on the most lucrative leads.
Seeing the value per lead by source also shows weak areas where the sales process needs improvement.
Sales Cycle
In addition to knowing how successful your sales team’s efforts are, you need to understand what goes into selling and how long it takes. This will vary based on your company and sales strategy. For example, the sales cycle for consultative selling is more involved than transactional selling.
A typical sales cycle of 15 days will tell a very different forecasting story than a six-month sales cycle. Starting with an understanding of how long a typical sale takes, keep track of which promotions reduce the sales cycle the most. Offering a deal to leads at a certain stage of the sales cycle or setting up a contest between sales reps can give sales a boost.
In addition to understanding the sales cycle from a company level, new outside sales reps should also have a 30-60-90 Day Sales Plan. This type of onboarding guide keeps new hires focused and learning everything they need to know within their first months on the job.
Pipeline Forecast
With your win rates in hand, it’s time to turn to the sales pipeline. Count the total open and closed sales by team and individual each quarter. Measure the corresponding value of sales by quarter, as well. If you aren’t able to accurately forecast it will be nearly impossible to manage your sales team.
Outreach Effectiveness
Are the sales scripts and processes your reps are following returning results? Track engagement rates for each team member. Your CRM should provide the conversion rate for engagement tactics. Another useful metric for monitoring outside sales rep activity is a measure of “touch counts.”
Seeing whether or not a sales rep is following up the appropriate amount of times helps you keep the team accountable.
Lead Response Time
Prompt communication can make or break a sale. Keep track of average response time, and the percentage of responses sent within the desired timeframe. Lead efficiency can also be uncovered through the percent of qualified leads.
How to Make Metrics Matter
Data is important, but it isn’t enough to dump a bunch of numbers and KPIs into a report for upper management. Without a succinct analysis, numbers don’t matter.
By tracking sales operations metrics over time, you’ll be able to create a quarterly story for both your team and your superiors. Compare this quarter’s metrics to past performance, and use the difference to convey weak points and strong suits.
Is the sales cycle becoming more or less efficient? Are hiring and retention efforts continuing to work and are team members using your CRM to its fullest potential?
Metrics including the number of sales reps you have, average deal size, and win rate come together in a forecast to determine if you’re set up for realistic success. You’ll then need to combine your goals for the upcoming quarter with any limitations, such as a hiring budget, to prioritize improvements.
Creating a short narrative based on the changes you see will help you convey the current state to those around you, as well as organize your strategy for improvement in the coming quarter.
_____
Questions or comments? Contact SPOTIO at [email protected] or comment below.
SPOTIO is the #1 field sales acceleration platform to increase your revenue, maximize your profitability, and increase your team’s productivity.
Want to see a product demonstration? Click here to see how SPOTIO can take your sales game to the next level.