Field sales leaders run distributed teams. Your reps are spread across territories, logging visits from parking lots, and closing deals on doorsteps — not sitting in an office staring at a CRM. But the reports most sales orgs rely on were designed for inside sales teams working from a single dashboard. Territory coverage, location-verified activity, and route-level performance don’t appear in standard CRM reports because those systems weren’t built for your world.
That’s a problem at every level. Frontline managers can’t coach what they can’t see. VPs can’t forecast revenue when field activity data lags by days. And the org keeps paying the admin tax — field reps spend 21% of their work week on administrative tasks and data entry, roughly 8 hours per rep that don’t generate revenue. For a team of 10, that’s 4,400+ hours a year buried in non-selling work, much of it manual reporting. Salesforce’s 2026 State of Sales research confirms the broader pattern — sales reps across all roles spend more than half their time on non-selling work.
This guide covers the 10 sales reports field sales teams actually need, what each one tells you at the manager, director, and VP level, how to structure your reporting cadence, and how AI is changing the way sales leaders interact with their data.
What Is a Sales Report?
A sales report is a structured document that tracks sales activities, outcomes, and trends over a defined period. Every report answers one of three questions: What did the team do? (activity reports), What resulted? (outcome reports), or Why did it happen? (diagnostic reports).
Field sales reporting is different from inside sales reporting because the data inputs are different. Inside sales tracks calls logged, emails sent, and CRM stage changes — all captured automatically through desk-based tools. Field sales data comes from GPS-verified visits, territory coverage patterns, route completions, and in-person meeting outcomes. If your reporting system doesn’t capture what happens between the office and the door, you’re making decisions from incomplete data.
Why Reports Matter Beyond the Manager Level
Most reporting guidance focuses on the frontline manager — coaching reps, running pipeline meetings, reviewing weekly numbers. That’s important, but it’s only one layer.
At the director and VP level, sales reports answer strategic questions: Is the territory map aligned with market opportunity, or is it legacy allocation? Is revenue concentration spread across the team or stacked on a few people? Are we adding reps in the right places, or throwing headcount at the wrong problem?
Reports also surface the org-level inefficiencies that compound silently. SPOTIO’s State of Field Sales research found that nearly two-thirds of B2B field reps spend 5+ hours per week on CRM data entry alone — and nearly half spend a full workday or more. If that burden is invisible in your reports, you’re missing a major lever for capacity improvement.
10 Sales Reports for Field Teams
Activity Report
Tracks what reps actually do each day — door knocks, site visits, calls, emails, texts, check-ins, and route completions.
Manager view: Is the rep putting in enough effort? Low activity usually means a motivation or time management issue. High activity with low results points to a skill gap — the rep is working hard but needs coaching on quality, not quantity.
VP view: Is the team’s total activity volume on pace for quota? If activity is flat but headcount grew, you have an onboarding or engagement problem that hiring won’t fix.
Field-specific note: Activity reports in field sales should include location-verified data — not just self-reported numbers. GPS-verified check-ins eliminate the “I knocked 50 doors” claim that nobody can validate. They also reveal patterns: which reps consistently cover their full routes vs. those who cluster in comfortable areas. For a deeper look at what to track and how, see our guide to activity tracking for field sales leaders.
Pipeline Report
A stage-by-stage view of leads, opportunities, and deals across your team.
Manager view: Where are deals stalling? If your pipeline is fat at the top and thin at the bottom, reps are generating interest but not advancing it. If it’s the reverse, prospecting has dried up and you’re living off existing pipeline — a problem that won’t surface in revenue numbers for 30–60 days.
VP view: Is total pipeline coverage sufficient? Most field sales orgs need 3-4x pipeline coverage to hit quota reliably. If coverage drops below that threshold, it’s a leading indicator that next quarter’s number is at risk — regardless of what this month’s revenue looks like.
Field-specific note: Field sales cycles are often longer and less linear than inside sales. A rep may visit a prospect three times before the deal moves from “interested” to “opportunity.” Pipeline reports that only count CRM stage changes miss those intermediate touches.
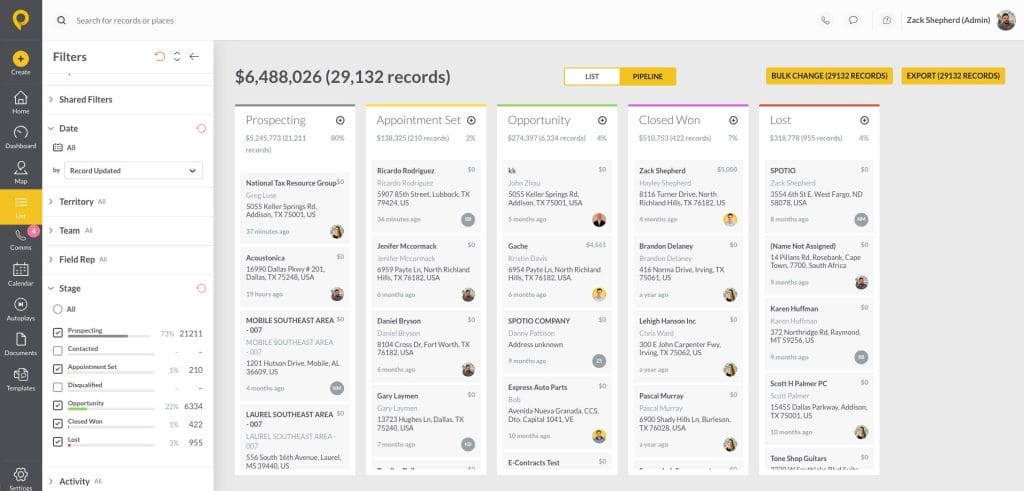
SPOTIO Pipeline Report
Territory Performance Report
Revenue, activity volume, and conversion rates broken down by territory.
Manager view: Which territories are producing and which are underperforming? A territory producing low revenue might have a weak rep — or it might be undersized, oversaturated, or misaligned with market potential.
VP view: Is the territory map aligned with opportunity? One distribution company discovered that 60–80% of their West Coast territory was uninhabited land. They’d been measuring rep output against territory potential they’d never quantified. The territory performance report is where that kind of structural misalignment becomes visible.
Field-specific note: Territory reports for field teams should normalize for density and potential, not just raw revenue. An urban territory generating $200K looks different from a rural territory generating $150K when the rural rep drives twice the distance to reach half the doors.
Revenue by Rep Report
Individual revenue output per rep over a defined period.
Manager view: Who needs coaching, and who should get your highest-value leads? If a rep consistently closes below the team average, the revenue-by-rep report tells you there’s a problem — the activity and conversion reports tell you where it is.
VP view: Is revenue spread across the team or stacked on a few people? If three reps produce 60% of your team’s revenue and seven produce the other 40%, you have a fragility problem. Losing one top performer could blow a hole in the quarter. The rev-by-rep report is where you see whether your team’s output is distributed or dangerously top-heavy.
Conversion Report
Activity-to-outcome ratios at each stage of your sales process.
Manager view: Where is each rep leaking? A rep with a strong door-knock-to-appointment ratio but a weak appointment-to-proposal ratio has a different coaching need than one who sets plenty of proposals but can’t close.
VP view: What’s the team-level conversion benchmark, and how does it trend quarter over quarter? Declining conversion at a specific stage is an early warning — it tells you where the process is breaking before the revenue impact hits.
Field-specific note: Field conversion metrics should be tracked at granular stages: door knock → appointment set → proposal delivered → deal closed. Inside sales typically starts at “lead received.” Field sales starts at the door.
Win-Loss Analysis
Deals won vs. lost, categorized by reason.
Manager view: Patterns in individual rep losses. Does one rep consistently lose to a specific competitor? Does another lose deals after the proposal stage — suggesting a pricing or presentation issue?
VP view: Systemic loss patterns that signal product, pricing, or targeting problems. If 40% of lost deals cite the same competitor or the same objection, that’s not a rep issue — it’s a strategic one.
Field-specific note: Loss reasons in field sales often differ from inside sales. “Caught the prospect at the wrong time” and “competitor already on-site” are field-specific losses that don’t appear in standard CRM loss-reason picklists. Make sure your loss categories reflect how deals actually die in the field.
Average Deal Size Report
Revenue per closed deal, tracked over time.
Manager view: Is a rep consistently closing smaller deals than the team average? That could mean discounting, targeting the wrong prospects, or failing to upsell during in-person conversations.
VP view: Is average deal size trending up or compressing? Compression often signals competitive pressure or a shift in the mix of prospects your reps are reaching. It also directly affects headcount planning: if deal size drops 20%, you need 25% more deals to hit the same revenue target.
Forecast Report
Projected revenue based on current pipeline, historical conversion rates, and deal velocity.
Manager view: Will we hit this month’s number? If the forecast says no, you have time to push stalled deals, increase outbound activity, or pull forward opportunities from next month.
VP view: Is next quarter on track, and where are the forecast risks? Forecasts built on field data are notoriously challenging because reps don’t update CRM between stops. One-tap activity capture that syncs to your pipeline without end-of-day data entry dramatically improves forecast accuracy by closing the gap between what happens in the field and what appears in the system. For tools that help, see our guide to sales forecasting software.
Leaderboard Report
Real-time ranking of reps by any metric you choose — revenue, activity volume, conversion rate, territory coverage.
Manager view: Who’s engaged and who’s coasting? Leaderboards work best when they track multiple metrics simultaneously so different reps can win in different categories. A rookie who can’t compete on revenue might lead in doors knocked. A veteran might dominate conversion rate.
VP view: Is competitive energy healthy or demoralizing the middle? If the same three reps top every leaderboard, the rest of the team checks out. The leaderboard report tells you whether your contest structure and recognition patterns are engaging the full team or just rewarding the usual suspects.
Field-specific note: Leaderboards connect directly to gamification and contest execution. For a deep dive on contest structures that engage entire teams, see our guide to sales contest ideas.
Upsell and Cross-Sell Report
Expansion revenue from existing accounts — what was sold, to whom, and by which rep.
Manager view: Which reps are expanding accounts vs. only chasing new logos? Field reps who revisit existing customers have a natural upsell advantage — they see the customer’s environment in person, notice new needs, and can pitch face-to-face.
VP view: What’s the ratio of new business to expansion revenue? Organizations that track this report frequently discover that their most profitable revenue comes from accounts they’ve already won — and that they’re underinvesting in account expansion because their incentive structure only rewards new business.
Choose the Right Reporting Cadence
Daily and Weekly Reports
Daily reports are for frontline managers. Track high-frequency activity metrics — visits completed, doors knocked, check-ins logged — to catch effort gaps before they compound into weekly misses. Automate daily reporting wherever possible. If reps are hand-building daily reports, that’s part of the admin tax.
Weekly reports are for team meetings. Track pipeline movement (what moved forward, what stalled, what’s new) and conversion trends. The weekly report should answer one question: are we on pace? For a deeper look at structuring pipeline reviews, see our sales pipeline reporting guide.
Monthly and Quarterly Reports
Monthly reports serve directors and VPs. Revenue trends, territory performance comparisons, forecast accuracy vs. actual results. Monthly is where you spot patterns that weekly noise obscures.
Quarterly reports are strategic. Territory rebalancing triggers, headcount planning, vertical performance, and year-over-year comparisons. These are the reports that go to the C-suite. They should be structured around decisions, not data: what’s working, what’s not, and what we’re changing.
How to Build a Field Sales Report
Start With Your Audience
A rep-level report tracks personal activity and individual conversion. A manager-level report covers team performance and pipeline health. A VP-level report addresses revenue predictability, territory ROI, and headcount efficiency. Don’t make VPs dig through rep-level detail, and don’t burden reps with org-level dashboards they can’t act on.
Select Metrics That Drive Decisions
Every metric in the report should trigger a “so what” action. If a number doesn’t change a decision, it doesn’t belong. Five to seven KPIs per report is the right range. More than that and the signal drowns in noise.
Automate Where Possible
The biggest reporting problem in field sales is data entry friction. Reps in the field don’t sit at a desk to update CRM after every stop. One-tap activity logging, GPS-verified check-ins, and real-time CRM sync eliminate the lag between field activity and reportable data. When activity capture happens at the point of action instead of at the end of the day, every downstream report gets more accurate.
Automation also extends to report delivery. If you can set recurring reports to auto-send to stakeholders — especially dailies and weeklies — that’s hours per week you reclaim for coaching and strategy. For a comparison of tools that handle this, see our sales reporting software guide.
Using AI to Build and Analyze Sales Reports
The reporting bottleneck for most field sales leaders isn’t data access — it’s the time between “I need to know X” and actually having the answer. AI tools are collapsing that cycle. Instead of building a report in your CRM, exporting to a spreadsheet, and formatting for a meeting, you can ask a plain-language question and get a usable answer in seconds.
This isn’t futuristic. The infrastructure already exists.
How AI Connects to Your Sales Data
Most major sales platforms now offer MCP (Model Context Protocol) servers — standardized connectors that let AI assistants like Claude, ChatGPT, or Copilot read data directly from your tools. Salesforce, HubSpot, Gong, and a growing number of sales platforms offer MCP servers or API-based AI integrations. That means your AI tool of choice can query your CRM, call intelligence platform, or field sales tool without you exporting anything.
The setup varies by platform and AI tool. The fastest way to find out what’s available for your stack: ask your AI assistant. A query like “How do I connect you to my Salesforce instance?” or “What MCP servers are available for HubSpot?” will surface current instructions. Most connections take minutes, not days.
What to Ask Once You’re Connected
The real value isn’t generating a prettier version of a report you already have — it’s asking questions you wouldn’t normally build a report to answer:
- “Which reps had the most visits last week but the fewest proposals? Show me the gap.”
- “Compare territory performance in the Southeast vs. Midwest for Q2 — revenue, activity volume, and conversion rate.”
- “What’s my pipeline coverage ratio for next month? Flag any rep below 3x.”
- “Pull my top 5 reps by conversion rate this quarter and show their average activity volume alongside it.”
- “Which territories have declining visit volume over the last 30 days compared to the prior 30?”
- “Summarize the key themes from our lost-deal notes this quarter.”
- “Cross-reference my pipeline forecast with actual closed revenue from the same period last year. Where’s the biggest gap?”
The org-level queries are where the time savings compound. A frontline manager asking “how is Rep X doing?” can find that in a dashboard. A VP asking “where is the machine breaking down across 8 territories and 40 reps?” — that’s the question that used to take a half-day spreadsheet exercise and now takes seconds.
Pro Tip: No MCP Server? Export and Upload. If your sales platform doesn’t offer an MCP server yet — or your IT team hasn’t approved the connection — you can still use AI for ad-hoc reporting. Export the data you need as a CSV or Excel file from your CRM or sales tool, then upload it directly to your AI assistant. You can ask the same kinds of questions: “Summarize conversion rates by territory from this spreadsheet” or “Flag any rep whose activity dropped more than 20% week over week.” It’s not as seamless as a live connection, but it turns a 45-minute spreadsheet exercise into a two-minute conversation.
A Note on Security and Data Sharing
If your team uses a company-paid AI tool (an enterprise Claude, ChatGPT, or Copilot plan with your organization’s data governance applied), your data stays within those contractual boundaries. But if individual managers are using free-tier or personal AI accounts, the data they paste or connect may be used for model training or stored outside your company’s control.
Before connecting any sales data to an AI tool, confirm with your IT or security team that the tool meets your organization’s data handling requirements. Key questions: Does the AI provider retain or train on our data? Is the connection SOC 2 compliant? Who at our company has authorized this integration? Most enterprise AI plans address these concerns explicitly — free-tier and personal accounts often do not. The rule of thumb: if you wouldn’t paste it into a public web form, don’t paste it into an AI tool your company hasn’t vetted.
Frequently Asked Questions
A sales report is a document that tracks sales activities, outcomes, and trends over a specific time period. Field sales reports typically cover activity volume (visits, door knocks, calls), pipeline health, territory performance, conversion rates, and revenue by rep. Sales leaders use them to evaluate what’s working, identify coaching needs, and make data-driven decisions about territory assignments, headcount, and strategy.
The most common types for field sales teams are activity reports, pipeline reports, territory performance reports, revenue by rep, conversion reports, win-loss analysis, average deal size, forecast reports, leaderboard reports, and upsell/cross-sell reports. Each answers a different question — from “are reps putting in the effort?” to “is the territory map aligned with opportunity?”
Daily reports track high-frequency activity (visits, check-ins) and are best automated. Weekly reports cover pipeline movement and conversion trends for team meetings. Monthly reports serve directors and VPs with revenue trends and territory comparisons. Quarterly reports are strategic — territory rebalancing, headcount planning, and C-suite presentations.
Field-specific metrics include GPS-verified visit counts, territory coverage percentage, route completion rates, door-knock-to-appointment ratios, and in-person meeting outcomes. Inside sales reports focus on calls, emails, and CRM stage changes — activities that happen at a desk. Field reporting must capture what happens between the office and the door.
Yes. AI assistants can connect to sales platforms like Salesforce, HubSpot, and Gong through MCP servers or API integrations, then answer plain-language questions about your pipeline, activity data, and revenue trends. If a live connection isn’t available, you can export data as a spreadsheet and upload it for analysis. Always use an enterprise-grade AI account to protect sensitive sales data.
A sales report is a point-in-time document that summarizes data for a specific audience and purpose — a weekly pipeline review, a monthly territory performance summary, a quarterly board presentation. A dashboard is a live, always-on view of current metrics. Reports are for analysis and communication. Dashboards are for monitoring. Most field sales leaders need both.
Build Reports That Drive Decisions
The reports that matter aren’t the ones with the most data points — they’re the ones that change what you do next. Whether you’re a frontline manager reviewing weekly activity or a VP building the quarterly territory plan, every report should answer a specific question and trigger a specific action.
Field sales teams that track performance with location-verified activity data, real-time leaderboards, and automated CRM sync spend less time building reports and more time acting on them. SPOTIO gives field sales leaders custom reporting, live dashboards, and one-tap activity capture that keeps the data clean without burdening reps. With DASH, SPOTIO’s AI co-pilot, reps can log visits, update records, and complete follow-ups through chat or voice — and every action shows a confirmation preview before it’s written, so your reporting data stays accurate without slowing reps down. Request a demo and see how reporting works when it’s built for teams that sell in the field.