We’ve gone over many of the most prominent forms of forecasting, and now it is time to review the use of Regression Analysis. Using this quantitative analytical method can improve business operations, sales, and marketing.
What is Regression Analysis Forecasting?
Regression Analysis forecasting is the most mathematically minded method is usually why people shy away from it. This technique is meant for those companies that need in-depth, granular, or quantitative knowledge of what might be impacting sales and how it can be changed in one direction or the other, as necessary.

Applying this method successfully requires comprehensive understanding of statistics and the influences that exert their power on your company’s sales performance. There are many calculations required to examine relationships between sales and variables that impact sales.
To use this you would start to figuring out the reasons you are forecasting, essentially what it is you want to learn and why that would be valuable. From there you figure out the factor that is being affected which in this case is the dependent variable, your sales.
Add to this the factors that impact the dependent variable, anything that influences sales. Then, select the period of time you want to review and collect the data for the variables in question.
From there, you choose your regression model and run it after which you find any correlation between those variables.
Example of Regression Analysis Forecasting
Your business wants to forecast your sales for the upcoming summer program in order to plan for your budget and figure out if you need to conduct a second round of hiring for temporary sales reps. In this scenario, the sales team is the dependent variable and your goal is to understand what influences it.
So, you compare the sales to an independent variable, like the number of sales calls. Then you collect data for both the total seasonal sales and the total seasonal sales calls for the last five years.
The goal here, again, is to compare what influences the number of calls had on the number of sales.
Once you set everything up and have the data, you can get even more granular with that information and review the number of sales calls as it impacts the number of sales each year, and then again for each month during the sales season so that you can determine not only how many new sales reps to hire the following year, but for precisely what months you need to ramp up seasonal sales reps. Then, you filter them out as the sales calls and subsequently the sales themselves, start to thin out.
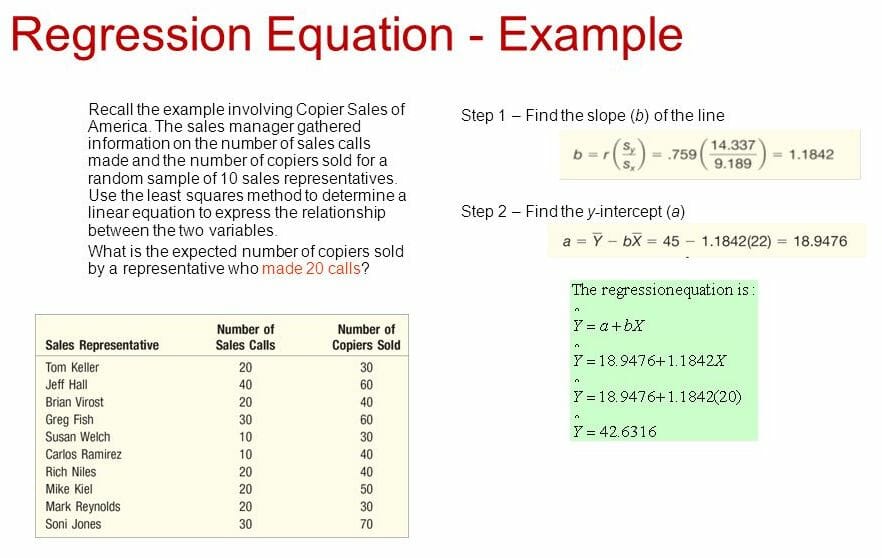
The regression model equation might be as simple as Y = a + bX in which case the Y is your Sales, the ‘a’ is the intercept and the ‘b’ is the slope. You would need regression software to run an effective analysis. You are trying to find the best fit in order to uncover the relationship between these variables.

With this model you might see how something correlated to your sales that could be causing your sales to get better or worse. However, just because there is a correlated variable does not mean the variable itself is the cause.
This is where things get a bit complicated.
You need to take into consideration other factors that make the example too complicated for this short article. Additionally, this particular example is a rudimentary, linear one and in most real time cases your business will have a multiple linear regression. This contains multiple independent variable like the numbers of training sessions help, the number of incoming calls, the number of emails sent, etc.
Pros and Cons

The upside is that this helps you determine the precise variables that impact sales at any given time. In other words, this is one of the most accurate forms of forecasting out there. If you want the real-time data, and only the data, this is how you get it.
The downside is that this is accurate, but is incredibly advanced. Be fair warned that the reason most companies don’t use it or shy away from it, is because not just anyone can do it. It’s certainly not the easiest method to use.
For many companies, the variables that have to be taken into account in order to generate proper forecasts requires someone with a PhD in mathematics to figure out. This is especially true for larger companies. To that end, the larger amounts of accurate data is effectively a requirement in order to achieve meaningful results, and the large amounts can be tricky.
Should You Use Regression Analysis Forecasting?
Regression Analysis is a highly data driven method which is why it takes skill and regular practice to do it well. Not only will you need to refine your ability to execute it, but to understand the results generated therein.
However, if you are able to properly run your regressions, soon your company will be able to uncover valuable information about the company that can be used to drive growth in the future.
Much like the other methods of sales forecasting, regression analysis may not necessarily be the optimum solution for your business. To that end, it is imperative to know how each method works and when it works best in order to determine if/when it is most suitable for your company.
Moreover, this does not have to function as a standalone tool; your business might very well benefit from integrating more than one method particularly if one is a quantitative method designed to counterbalance and complement a qualitative method.
Wrapping Up
By using sales forecasting techniques correctly you will be able to identify potential problems early on, evaluate your sales opportunities, track the progress of individual reps, and prepare post-sales support systems as needed such as infrastructure and materials.
__________
Questions or comments? Contact SPOTIO at [email protected] or comment below.
SPOTIO is the #1 field sales acceleration and performance management software that will increase revenue, maximize profitability, and boost sales productivity.
Want to see a product demonstration? Click here to see how SPOTIO can take your sales game to the next level.


