It’s Monday morning. You have a pipeline review in 30 minutes and you’re staring at a list of 40 open deals, trying to remember which ones moved last week and which ones have been sitting in “proposal sent” since the previous quarter. Sound familiar?
That’s not a rep problem. That’s a pipeline reporting problem — and it’s fixable.
Sales pipeline reporting gives you a structured, repeatable way to see exactly where your deals stand, which reps are on track, and where your biggest risks are hiding before they blow up your number. Done right, it’s the single most useful management tool a field sales leader has. Done wrong — or not at all — you’re running your team on gut feel and hope.
This guide covers what a sales pipeline report is, why it matters for managers whose reps are out in the field, exactly what to put in one, and how to build a review process that actually catches problems in time to fix them.
Pipeline reports are one piece of a larger reporting architecture. For a complete overview of the 10 sales reports field sales teams should run — including activity, territory, conversion, and forecast reports — start with our full sales reporting guide.
What Is a Sales Pipeline Report?
A sales pipeline report is a structured snapshot of every active deal in your sales funnel — where each deal stands, what it’s worth, how long it’s been there, and what happens next. It tells you how healthy your pipeline is right now and gives you the information you need to predict what will close, what will stall, and what needs your attention today.
A pipeline report is not the same as a sales forecast. A forecast estimates future revenue based on probabilities. A pipeline report shows you the raw material — the actual deals, stages, ages, and values — that make a forecast meaningful. You need the report to trust the forecast.
Pipeline Report vs. Sales Forecast vs. Sales Funnel
These three terms are often used interchangeably. They shouldn’t be:
- Pipeline report: A real-time or weekly view of all active deals — stage, value, rep, days in stage, next step
- Sales forecast: A revenue prediction built by applying close probabilities to your pipeline data
- Sales funnel: A conceptual model of the buyer’s journey from awareness to purchase; useful for strategy, not day-to-day management
Most pipeline reporting problems start here — managers try to do all three jobs with one report, and end up with something that does none of them well.
Why Pipeline Reporting Matters for Field Sales Managers
Pipeline reporting matters for every sales manager. But it matters differently for field sales managers — because your reps aren’t sitting 10 feet away from you. They’re in trucks, knocking doors, driving from appointment to appointment. By the time you notice a deal is stalling, it may have been cold for three weeks — which is why sales pipeline management and pipeline reporting have to work together.
Spot Deal Slippage Before It’s Too Late
The biggest cost of poor pipeline reporting isn’t bad data — it’s late data. When you review deals weekly, you catch slippage early enough to coach around it. When you review monthly, you discover problems after the quarter is already in trouble.
Deal aging is the most important metric most pipeline reports don’t track. A deal that’s been in “proposal sent” for 45 days isn’t a pipeline asset — it’s a placeholder. Knowing which deals have gone stale, and having a conversation with the rep about it that week, is the difference between saving the deal and writing it off.
Evaluate Rep Performance at the Stage Level
Pipeline reports let you coach at the level where deals actually die — the stage transition. It’s not enough to know a rep has a low close rate. You want to know where deals are falling out. Is it at qualification? Proposal? Closing? The answer tells you exactly what to coach.
For a field sales team, this is especially powerful. You can see which reps are generating lots of first appointments but rarely progressing to proposals — that’s a pitch problem. Or which reps have healthy early-stage pipelines but deals mysteriously disappearing after demos — that’s a follow-through problem. Stage-level visibility turns a coaching conversation from “you need to close more” into “here’s the exact moment you’re losing deals.”
Deliver Forecasts Executives Actually Trust
Execs don’t want pipeline theater. They want to know what’s going to close, with confidence. The only way to give them that is to maintain a clean, regularly reviewed pipeline with accurate stage data and realistic probabilities.
Field sales teams that run consistent weekly pipeline reviews produce more accurate forecasts — not because they have better deals, but because their data is fresher and their managers have already stress-tested the assumptions behind each number.
Catch Territory and Coverage Problems Early
Pipeline reporting is also a territory health check. If one rep’s pipeline is running thin while another’s is overloaded, that’s a territory issue — not just an individual performance issue. Regular reporting makes these imbalances visible before they cost you quota.
What to Cover in a Sales Pipeline Report
A useful pipeline report isn’t a data dump. It’s a curated set of metrics that answer one question: where do we stand and what do we do about it? Here’s what belongs in it. For a deeper look at how to calculate and benchmark each of these, see our guide to sales pipeline metrics.
Core Pipeline KPIs and Formulas
Include these metrics in every pipeline report. The formulas are here so you can calculate them without relying on CRM auto-calculations that may define them differently than you do.
| Metric | Formula | Field Sales Benchmark |
|---|---|---|
| Total pipeline value | Sum of all open deal values | Aim for 3x–4x your quota target |
| Pipeline coverage ratio | Total pipeline value ÷ quota target | Below 3x = at-risk; above 5x = likely inflated |
| Lead-to-opportunity conversion rate | (Opportunities created ÷ leads worked) × 100 | Varies; track directionally, not against a universal benchmark |
| Close rate (win rate) | (Deals won ÷ total deals closed) × 100 | D2D/field sales varies widely by vertical and product |
| Average sales cycle length | Total days to close ÷ number of deals closed | Set your own baseline, then watch for lengthening trends |
| Pipeline velocity | (# opportunities × avg deal value × win rate) ÷ avg sales cycle days | A dollar-per-day figure; useful for week-over-week trend comparison |
A note on pipeline coverage: 1x coverage is not enough. If a rep’s open pipeline equals their quota target, they’re at serious risk of missing — because not every deal closes. Healthy coverage is 3x–4x quota. Below that, the conversation isn’t about closing harder; it’s about adding deals at the top.
Deal Aging and Stalled Deals
This is the section most pipeline reports skip — and it’s the most valuable one for a field sales manager.
Deal aging tracks how long each deal has been in its current stage. You set a threshold (say, 14 days in any one stage for a 30-day sales cycle), and any deal that exceeds it gets flagged. That flag is the start of a coaching conversation, not a write-off.
Stalled deals are the silent killers of pipeline health. They inflate your pipeline value without contributing to real forecast accuracy. 89% of B2B buyers report a purchase deal stalling on them in the past year — and the clock is punishing: deals that close within 50 days carry a 47% win rate, while that drops to 20% or lower after that threshold. A field sales team running a weekly review with an aging flag built in will consistently surface deals that reps consider “active” but haven’t touched in weeks.
Include in your report:
- Days in current stage (for every open deal)
- Last activity date
- Next step and next step due date
If a deal has no next step logged, it’s stalling. Full stop.
Want to see what these reports look like in practice? Request a demo to see SPOTIO’s pipeline visibility, rep-level activity tracking, and deal-stage reporting in action.
Rep-Level vs. Team-Level Views
Your pipeline report should work at two levels:
Team-level (for forecasting and exec reporting): Total pipeline value, pipeline coverage, weighted forecast, deals by stage, average sales cycle. This is what you bring to your VP or board-level review.
Rep-level (for coaching): Individual pipeline coverage, stage distribution, aging deals, activity ratios. This is what you use in your 1:1s. Don’t average away the rep-level data in your team report — keep both views accessible.
Sales Pipeline Report Example
Here’s what a functional field sales pipeline report looks like in practice. This isn’t a CRM dashboard — it’s the stripped-down version a manager actually reads in a Monday morning review.
| Deal | Stage | Value | Days in Stage | Last Activity | Next Step | Owner |
|---|---|---|---|---|---|---|
| Westfield Roofing | Proposal Sent | $18,500 | 4 | 5/26 | Follow-up call 5/30 | Torres |
| Sunrise Telecom | On-Site Demo | $31,000 | 11 | 5/25 | Send proposal by 5/31 | Patel |
| Mesa Home Services | Qualified | $9,200 | 22 ⚠️ | 5/14 | None logged | Williams |
| Delta Security | Contract Review | $24,000 | 6 | 5/27 | Check in 6/2 | Torres |
| Horizon HVAC | Initial Contact | $7,500 | 3 | 5/27 | Schedule walkthrough | Chen |
The flagged row — Mesa Home Services, 22 days in Qualified with no next step logged — is where the manager’s attention goes first. Not because it’s the biggest deal, but because it’s the most at risk. That’s the conversation in the 1:1 with Williams that week.
What a field sales manager reads first: Days in stage and next step. Pipeline value is secondary. The question isn’t “how much could we close?” — it’s “which of these deals is actually moving, and which ones are we kidding ourselves about?”
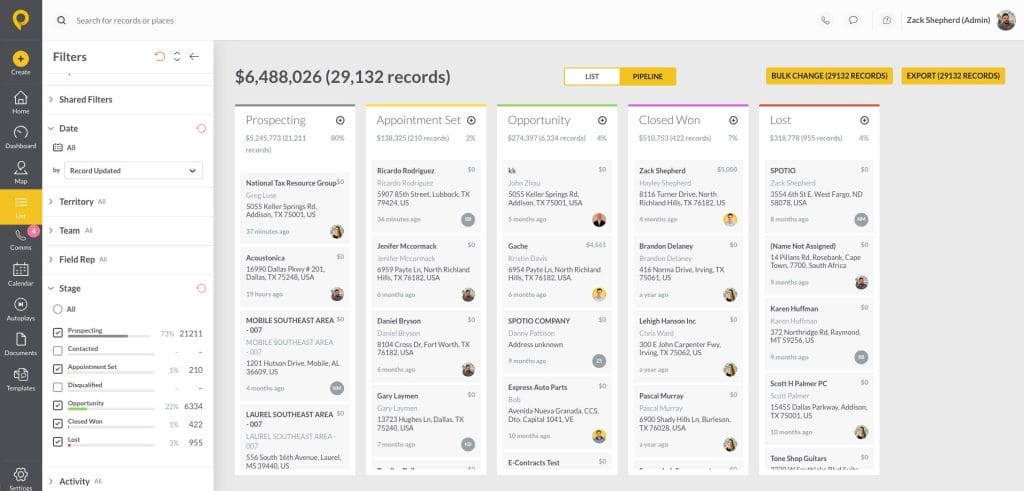
SPOTIO’s pipeline reporting gives field sales managers visibility into deal stage and rep-level activity across their entire team.
How to Build a Sales Pipeline Report
Building a pipeline report isn’t complicated. Getting your team to actually use it is the harder part.
Decide What to Measure First
Before you pull a single report, get clear on your audience and purpose. A pipeline report for a weekly team review should look different from one you’re sending to your VP of Sales, which should look different from the one you’re using in your rep 1:1s.
Start with three questions:
- Who is reading this?
- What decision are they trying to make?
- What’s the minimum data they need to make it?
A report you build to coach reps needs deal-level aging and activity data. A report for leadership needs coverage ratio, weighted forecast, and stage distribution. Combining them into one report usually means it serves neither audience well.
Pull It from Your CRM
Your CRM is the source of truth — but only if your reps are updating it consistently. This is the field sales-specific problem most pipeline reporting guides don’t address: reps who are in the field all day have less time and fewer natural moments to log activity than inside sales reps at desks.
The fix isn’t better reporting — it’s lower-friction logging. When reps can log a visit outcome in one tap between stops, your CRM data stays current. When logging requires navigating five screens and typing notes on a phone while parked in a driveway, it doesn’t happen.
Before you trust your pipeline report, audit your data quality. Ask: when was the last activity logged on each open deal? If a third of your “active” deals haven’t had an activity logged in 10+ days, your report isn’t showing you the pipeline — it’s showing you a wishlist.
Set a Weekly Review Cadence
The most common pipeline reporting failure isn’t the report itself — it’s reviewing it once a month, discovering problems too late to fix them, and then losing confidence in the process entirely.
The cadence that works for most field sales teams:
- Weekly (manager review, 30 minutes): Pull the full pipeline report. Flag any deal aging past your threshold. Note any rep whose coverage has dropped below 3x. Bring your top 5–10 deals by value and flag deals to each 1:1 that week.
- Weekly (1:1 with each rep, 15–20 minutes): Review their individual pipeline. Focus on aging deals first. Agree on next steps with specific due dates for every active deal. Remove deals that have gone cold — clean pipelines are more accurate than padded ones.
- Monthly (exec/team report): Weighted pipeline by stage, coverage ratio, forecast vs. actual tracking. This is the roll-up, not the coaching tool.
Consistency matters more than sophistication. A simple report reviewed every week beats a complex dashboard reviewed whenever someone asks about the number.
Sales Pipeline Reporting Best Practices
Match the Report to the Audience
An executive wants to know: are we on track for the quarter, and where are the risks? A rep wants to know: which of my deals should I focus on this week? Build for the audience, not for comprehensiveness.
Flag Aging Deals as a Standard Column
Don’t rely on yourself to notice which deals have been sitting too long. Build aging into the report structure itself — a column that calculates days in current stage and auto-flags anything over your threshold. Make it visible, not something you have to hunt for.
Remove Deals That Aren’t Moving
A clean pipeline is a more accurate pipeline. Reps are often reluctant to lose a deal — closing it as “lost” feels like failure. But keeping cold deals in the active pipeline inflates coverage, muddies forecast accuracy, and gives everyone a false sense of security. Create a simple standard: if there’s been no prospect-initiated contact and no meaningful progress in 30 days, it comes out of the active pipeline. It can go into a nurture list. It doesn’t belong in your weekly review.
Separate Pipeline Coverage from Forecast
Your coverage ratio and your forecast are answering different questions. Coverage tells you whether you have enough opportunity to hit your number. Forecast tells you how much of that opportunity is likely to close. Don’t conflate them — a team with 4x coverage and a 20% win rate is not in the same position as a team with 4x coverage and a 40% win rate.
Review the Process, Not Just the Numbers
Once a quarter, step back and ask: what stage are we losing the most deals at? If you’re consistently losing at proposal, that’s a pricing or value-framing problem. If you’re losing at qualification, your reps are spending time on deals that were never real. The pipeline report shows you the pattern; it’s your job to diagnose the root cause and fix the process.
Frequently Asked Questions
Sales pipeline reporting is the practice of regularly reviewing your active deals — where they are in the sales process, what they’re worth, how long they’ve been there, and what’s needed to advance them. It gives sales managers the visibility to coach proactively, forecast accurately, and catch problems before they cost quota.
A pipeline report shows you the raw data: every open deal, its stage, value, age, and next step. A sales forecast takes that data and applies close probabilities to estimate future revenue. You need an accurate pipeline report to produce a trustworthy forecast — one doesn’t replace the other.
For field sales managers, weekly is the right cadence for deal-level reviews. Monthly reviews are too infrequent to catch stalling deals in time to save them. The weekly manager review (30 minutes) combined with weekly rep 1:1s (15–20 minutes each) is the minimum structure that keeps pipeline data current and actionable.
At minimum: total pipeline value, pipeline coverage ratio (aim for 3x–4x quota), deal count by stage, days in current stage, close rate, and average sales cycle length. For coaching purposes, add last activity date and next step for every deal. Pipeline velocity — dollar value flowing through your pipeline per day — is useful for week-over-week trend comparison.
Most field sales teams target 3x–4x pipeline coverage relative to quota. Below 3x means you likely don’t have enough deals to hit your number even with a normal close rate. Above 5x may signal pipeline bloat — deals that aren’t real but haven’t been removed. Note that coverage benchmarks vary by industry, sales cycle length, and average deal size; establish your own baseline before comparing externally.
First, diagnose whether the deal is stalling or dead. A stalling deal has a clear next step and an engaged prospect; it just needs a push. A dead deal has no prospect-initiated contact in 30+ days and a rep who can’t articulate what would move it forward. For genuine stalls, the fix is usually a specific next step with a deadline. For dead deals, the fix is removing them from the active pipeline — not because the prospect is lost forever, but because a padded pipeline costs you forecast accuracy and coaching clarity.
Most CRMs can generate pipeline reports automatically if your stage data and activity logging are current. The automation challenge in field sales is data freshness — reports are only as good as the activity data feeding them. Teams that use mobile-first tools where reps can log an outcome with one tap — or use an AI co-pilot like SPOTIO’s DASH Actions to update records through a quick voice message or chat command, with a confirmation preview before anything saves — tend to have significantly cleaner pipeline data and more reliable automated reports. If you’re evaluating dedicated reporting tools that sit on top of your CRM for deeper pipeline analysis, see the guide to best sales reporting software for field teams.
Simplify Pipeline Reporting With SPOTIO
Consistent pipeline reporting comes down to one thing: data you can trust. And that starts with reps actually logging their activity in the field, not reconstructing it at 9pm from memory.
SPOTIO is built for field sales teams. Reps log visit outcomes in one tap between stops. Managers get pipeline and activity data that reflects what’s actually happening in the field — not what reps remember to enter when they get home. When your underlying data is current, your pipeline reports become a reliable management tool instead of a weekly exercise in skepticism.
See how field sales teams use SPOTIO to keep pipeline data current → Request a demo