
Just one in three sales leaders report that 70% or more of their team consistently hits quota. The reasons vary — too few quality leads, deals stalling mid-cycle, reps closing efficiently but targeting the wrong accounts. The hard part isn’t knowing something is wrong. It’s knowing exactly where to look.
Most pipeline reviews follow a familiar script. The manager pulls up the numbers, the team reports what’s in each stage, and everyone leaves feeling like the pipeline looks “healthy enough.” Two weeks later, the month closes short.
This guide covers the pipeline metrics that matter most for field sales teams — the ones that connect to rep behavior, territory performance, and forecast accuracy. Each metric includes a formula, a field-sales benchmark, and a clear signal for when something’s off.
What Makes a Pipeline Metric Useful
Not every metric belongs on your weekly review dashboard. The best pipeline metrics share three qualities: they’re measurable at the rep level, they’re actionable (meaning you can do something different when the number moves), and they’re connected to revenue outcomes, not just activity.
Leading vs. Lagging Indicators
Lagging indicators tell you what already happened — closed deals, win rate, revenue. They’re important for tracking progress but useless for course-correcting in the moment.
Leading indicators tell you what’s about to happen — new qualified leads, meetings booked, pipeline coverage. Field managers should spend most of their attention here, because they still have time to act.
The most useful pipeline review combines both: lagging metrics to assess what worked, leading metrics to steer what’s next.
The Metrics Field Sales Teams Drop First
Two metrics that appear on generic pipeline lists don’t belong in a field sales review: CLV:CAC ratio and referral rate. Both are valuable for a CFO or a customer success team — neither is something a field manager can move week to week.
Drop them from your operational cadence. Replace the attention you’d spend on them with pipeline coverage ratio and rep-level conversion rates, which are directly actionable in the field.
The Core Field Sales Pipeline Metrics
These five metrics form the foundation of a healthy pipeline review. Track them at the rep level and the territory level — not just as team aggregates.
New Qualified Leads Per Week
What it tells you: Whether your reps are filling the top of the funnel fast enough to hit revenue targets at the end of the month.
Formula: Count of new leads added that meet your qualification criteria within the week.
Field sales benchmark: This varies by vertical and territory density. For example, a D2D home services rep working a tight residential territory might qualify 30–50 leads per week. A B2B field rep managing a multi-state territory might qualify 10–15. What matters isn’t the number — it’s consistency and whether the volume supports your conversion math downstream.
Warning signal: If your sales activity metrics show qualified leads dropping two weeks in a row, you have a prospecting problem, not a closing problem. Don’t wait until month-end to find out.
Lead-to-Opportunity Conversion Rate
What it tells you: Whether your reps are qualifying leads accurately — and whether the leads themselves are worth pursuing.
Formula: (Opportunities ÷ Total Leads) × 100
Field sales benchmark: A conversion rate below 10% typically signals a lead quality issue — reps are chasing too broad, or the territory’s prospect list needs refinement. Above 30% can indicate over-qualification (reps are only working the easy leads and leaving volume on the table).
Warning signal: Wide variation between reps on this metric is often a coaching signal. If one rep converts 25% of leads to opportunities and another converts 8%, the gap usually points to qualification skills or territory quality — both fixable.
Win Rate
What it tells you: How efficiently your team converts opportunities into closed deals — the clearest single signal of overall sales effectiveness.
Formula: (Closed Won Deals ÷ Total Opportunities) × 100
Field sales benchmark: The average B2B win rate sits around 19–21%, according to HubSpot’s 2024 Sales Trends Report — meaning four out of five qualified opportunities don’t close. B2B field teams with tighter qualification often run 20–30%. For D2D and high-volume teams, the more meaningful benchmark is cold-knock conversion: industry data consistently puts this at 2–5% of doors knocked. What matters more than the absolute figure is trend — a declining win rate over two or three consecutive periods warrants investigation regardless of where it sits.
Warning signal: A high win rate paired with missed revenue targets almost always means a prospecting volume problem — reps are closing efficiently but not filling the top of the funnel. Pull the new leads metric first.
Average Sales Cycle Length
What it tells you: How long it takes a lead to move from first contact to a closed deal — and where deals are stalling.
Formula: Total days to close across all deals ÷ Number of closed deals
Field sales benchmark: The average B2B sales cycle runs one to three months for mid-market deals, with complex enterprise deals often exceeding five months. D2D and home services teams working shorter cycles often close in days to a few weeks. Storm restoration and roofing teams working seasonal windows often compress cycles to two to four weeks by necessity.
Warning signal: If your average sales cycle is lengthening, break it down by stage. A deal that sits in “proposal sent” for three weeks is a different problem than one that stalls at initial contact.
Average Deal Size
What it tells you: The revenue value of a typical closed deal — and whether your team is targeting the right accounts.
Formula: Total revenue from closed deals ÷ Number of closed deals
Field sales benchmark: This is vertical-dependent, but the more important signal is trend. If average deal size is declining, reps may be discounting to close, or they’re gravitating toward smaller, easier accounts and leaving larger opportunities behind.
Warning signal: Track average deal size by rep alongside win rate. A rep with a high win rate and low average deal size is closing, but possibly leaving money on the table. A rep with a high average deal size and low win rate may need help on smaller accounts to maintain pipeline volume.
Advanced Metrics for Pipeline Visibility
Once your team has a handle on the core five, these three metrics add forecasting depth and pipeline health diagnosis.
Sales Pipeline Velocity
Pipeline velocity measures how fast revenue is moving through your pipeline on a daily basis. It’s the single best metric for forecasting short-term revenue and identifying where to focus to close the gap.
Formula:
(Number of Deals × Win Rate % × Average Deal Size) ÷ Average Sales Cycle (days)
Example: A field team with 80 active opportunities, a 25% win rate, a $12,000 average deal size, and a 30-day average cycle has a daily pipeline velocity of:
80 × 0.25 × $12,000 ÷ 30 = $8,000/day
What to do with it: To increase velocity, you have four levers — add more deals, improve win rate, increase deal size, or shorten the sales cycle. Identify which lever is most actionable for your team right now and focus there.
Pipeline Coverage Ratio
Pipeline coverage ratio tells you whether your team has enough pipeline volume to hit quota — accounting for the fact that not every deal will close.
Formula:
Total Pipeline Value ÷ Revenue Target for the Period
Field sales benchmark: A 3x ratio is the widely cited starting benchmark for B2B teams. In practice, enterprise teams often target 3–5x; high-velocity field sales teams with shorter cycles may operate comfortably at 2–3x — the right number comes from your own win rate, not a generic rule of thumb.
Warning signal: If coverage drops below 2x with two weeks left in the period, it’s too late to fix through prospecting. Focus on accelerating deals already in the pipeline — not adding new ones.
Total Pipeline Value by Stage
Breaking pipeline value down by stage tells you where deals are concentrating — and where they’re stalling.
Track the value in each stage (lead, opportunity, proposal, close) weekly. A healthy pipeline shows a decreasing value as you move toward close — more in early stages, less but more certain in late stages. If you see a large value concentration stuck in one stage for multiple weeks, that’s a bottleneck that needs attention.
Pipeline Health and Rep Performance
A pipeline metric becomes most useful when it connects to a specific rep and a specific behavior. A team-level win rate of 18% doesn’t tell you what to do Monday morning. A breakdown showing Rep A at 28% and Rep B at 9% does.
What “Healthy” Looks Like by Stage
Use this as a quick-reference benchmark for field sales pipeline health:
| Metric | Healthy Range | Warning Signal |
|---|---|---|
| New qualified leads/week | Consistent with conversion math | Two consecutive weeks of decline |
| Lead-to-opportunity rate | 10–30% | Below 8% or above 35% |
| Win rate (B2B field) | 20–30% | Below 15% or declining trend |
| Win rate (D2D cold knock) | 2–5% of doors | Declining trend vs. prior period |
| Average sales cycle | Stable or shortening | Lengthening 20%+ vs. prior period |
| Pipeline coverage ratio | 3x+ (B2B), 2–3x (D2D/high-velocity) | Below 2x with <3 weeks left in period |
For a deeper look at pulling these numbers without spreadsheet exports, see our guide to sales pipeline reporting.
How to Use Pipeline Data to Coach Reps
Here’s a practical walkthrough. Suppose you’re reviewing your team going into the last two weeks of the month:
Rep A: 40 leads in pipeline, 22% win rate, average cycle 18 days, average deal size $8,500. Pipeline velocity: (40 × 0.22 × $8,500) ÷ 18 = $4,156/day. On track. No intervention needed.
Rep B: 40 leads, 9% win rate, average cycle 32 days, average deal size $7,200. Pipeline velocity: (40 × 0.09 × $7,200) ÷ 32 = $810/day. Significantly underperforming. The low win rate combined with a longer cycle suggests qualification issues — Rep B may be advancing leads that aren’t ready, which is stretching the cycle and dragging win rate down. This is a qualification coaching conversation, not a closing coaching conversation.
The point: the same number of leads in the pipeline produces wildly different revenue outcomes depending on how those leads are being worked. Sales performance metrics at the rep level show you where to intervene — and what kind of intervention makes sense.
Tracking Pipeline Metrics Without Spreadsheet Chaos
The biggest reason field sales managers don’t track these metrics consistently isn’t lack of interest — it’s that pulling the data manually takes time most managers don’t have. Field sales reps already spend 21% of their time on administrative tasks and data entry, according to SPOTIO’s 2026 State of Field Sales. Adding manual reporting on top of that is a structural problem, not a discipline problem.
The metrics are only useful if they’re visible before the pipeline review, not assembled during it.
What to Look for in a Reporting Tool
A field sales reporting setup should surface pipeline metrics at three levels without requiring a manager to build custom exports every week:
- Rep level: Win rate, conversion rate, average deal size, active pipeline value by stage
- Territory level: Pipeline coverage, new leads added, velocity trends
- Team level: Aggregated pipeline value, forecast vs. target, deal loss reason distribution
One criterion that gets overlooked: can your manager pull this data on a mobile device between appointments? If the pipeline review requires a laptop and a quiet office, it won’t happen consistently in the field. The reports need to be available wherever the manager is.
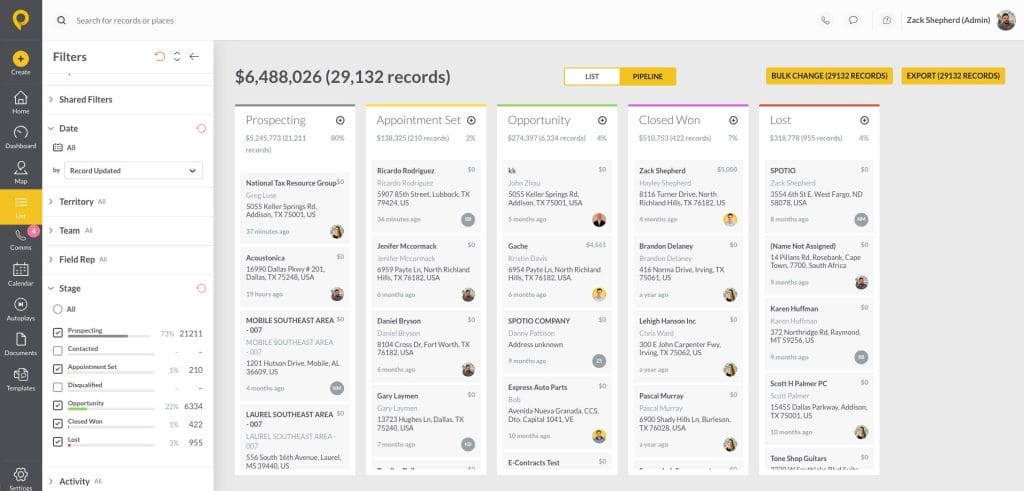
How SPOTIO Surfaces Pipeline Data
SPOTIO’s reporting dashboards give field managers a clear view of pipeline performance at the rep and territory level — including leads created by user, pipeline value over time, and deal stage distribution. No spreadsheet exports, no waiting for someone in ops to pull a report.
The deal loss reasons report is especially useful for diagnosing win rate problems. When reps log loss reasons with one tap after each lost deal — price, timing, feature gap, competitor — you can see the patterns across your team. If 40% of losses come back to price, that’s a coaching conversation. If it’s “not interested after second visit,” that’s a follow-up process problem. The data only works if reps are logging it consistently.
Managers can filter by rep, territory, and time period directly in the dashboard. The leaderboard view shows win rate, leads won, and one-tap logged activity volume side by side — so the connection between rep effort and pipeline outcomes is visible in one screen.
Frequently Asked Questions
Pipeline velocity = (Number of Deals × Win Rate % × Average Deal Size) ÷ Average Sales Cycle in Days. The result is the dollar amount moving through your pipeline per day. To increase velocity, focus on whichever of the four inputs is most improvable for your team — adding deals, improving win rate, increasing deal size, or shortening the cycle.
The average B2B win rate sits around 19–21% (HubSpot, 2024). B2B field teams with tighter qualification often run 20–30%. For D2D and high-volume teams, the relevant benchmark is cold-knock conversion: industry data puts this at 2–5% of doors knocked. The more important signal than the absolute number is trend — a declining win rate over two or three consecutive periods warrants investigation regardless of where it sits.
Core metrics (new leads, active pipeline by stage, deals at risk) should be reviewed weekly. Win rate, average deal size, and velocity are most useful reviewed monthly or by period so trends are visible. Rep-level coaching conversations should be grounded in at least four to six weeks of data before drawing conclusions.
Pipeline coverage ratio is total active pipeline value divided by your revenue target. A 3x ratio is the widely cited starting benchmark — it assumes roughly one in three deals will close. If your win rate is lower than 33%, you need a higher ratio to compensate. Field managers who track this weekly can identify a coverage problem early enough to act on it.For a deeper framework on evaluating pipeline health, see how to evaluate your sales pipeline.
Pipeline metrics measure the health and composition of your current pipeline — deal volume, stage distribution, velocity, coverage. Sales KPIs measure broader performance outcomes — quota attainment, revenue, rep productivity. Pipeline metrics are leading indicators; KPIs are largely lagging. Both matter, but pipeline metrics give you more time to act.
High activity with low win rate usually points to one of three issues: leads aren’t being qualified tightly enough before entering the pipeline, deals are advancing stages before the prospect is ready, or reps are focusing on volume over fit. Pull your lead-to-opportunity conversion rate and average sales cycle alongside win rate — if all three are off, it’s a qualification process issue. If win rate is low but conversion and cycle are normal, look at what’s happening at the proposal or close stage specifically.
Closing
The metrics that matter most for field sales teams aren’t the ones on every generic pipeline list. They’re the ones that connect to rep behavior, tell you where deals are stalling, and give you enough lead time to do something before the period closes.
Win rate, pipeline velocity, coverage ratio, and rep-level conversion data — tracked consistently and reviewed at the right level — give a field sales manager the same visibility over their sales pipeline management that a top-performing rep has over their territory. If you want to start from the foundations first, see our guide to understanding a sales pipeline.
SPOTIO helps field sales managers track these metrics at the rep, territory, and team level without manual exports or spreadsheet assembly. Teams using SPOTIO report a 46% increase in field sales productivity. If your current pipeline reviews feel more like a post-mortem than a planning session, request a demo to see how the reporting works.