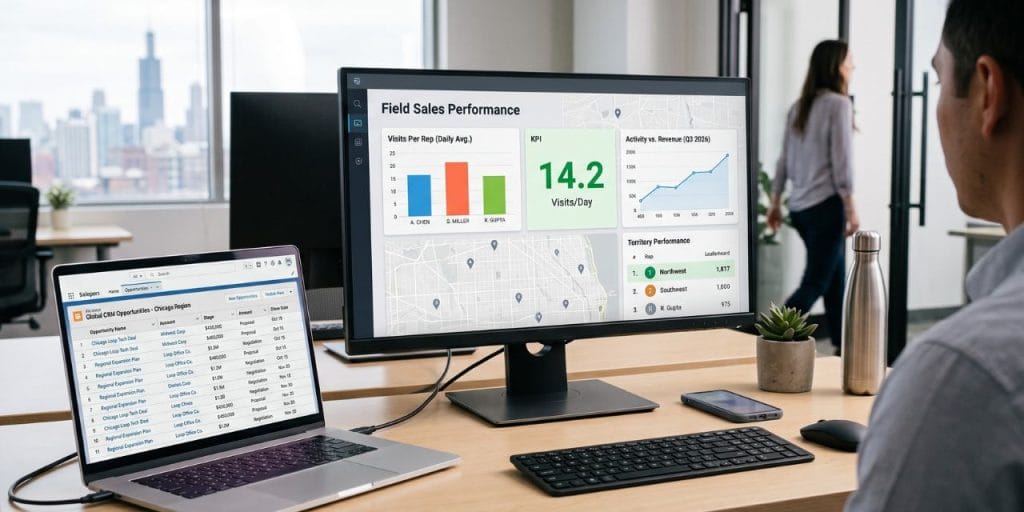

Your reps say they made 15 visits yesterday. Your CRM confirms it. But how many of those visits were actual face-to-face conversations — and how many were drive-bys that got logged as “completed”?
This is the blind spot that kills field sales teams. SPOTIO’s 2026 State of Field Sales survey found that field reps spend only 33–44% of their week in front of customers, while 18–21% disappears into administrative work and manual CRM entry. That means for a big chunk of your payroll, you’re paying for admin time instead of selling time — and making decisions based on data your reps entered themselves, often hours after the fact.
Field sales performance analytics closes that gap. It replaces guesswork with verified activity data, connects what reps do in the field to the revenue outcomes you care about, and gives you a clear picture of where your team is winning and where they’re stalling. This guide covers the 7 KPIs that actually move revenue, how to build a dashboard your managers will use every Monday morning, and why the shift from end-of-day reporting to location-verified analytics is changing how the best field teams operate.
What Is Field Sales Performance Analytics?
Field sales performance analytics is the practice of collecting, measuring, and acting on data generated by reps who sell face-to-face — in territories, at doorsteps, and inside customer locations. It’s different from generic sales analytics because the data itself is different. You’re not measuring email opens and demo bookings. You’re measuring visits, territory coverage, drive time, and whether reps are actually working the accounts that matter.
The distinction matters because field teams operate with a visibility problem that inside sales teams don’t have. When an SDR makes 50 calls, you can see every dial, every conversation, every outcome in your CRM. When a field rep makes 12 visits across a 40-mile territory, you see whatever they decide to type into Salesforce at 6 PM.
Why Generic CRM Reporting Falls Short for Field Teams
Most CRMs were built for inside sales. They track calls, emails, and pipeline stages — all activities that happen on a computer. Field sales adds layers that CRMs weren’t designed to capture: geography, route efficiency, physical visit verification, and territory density.
The result is a reporting gap. Managers pull CRM reports that show activity volume but miss the context that makes that activity meaningful. A rep who logs 12 visits looks identical to a rep who logs 12 visits and covers 80% of their assigned territory — unless your analytics platform understands territory coverage as a metric.
This is where location-verified activities change the equation. When GPS coordinates are attached to every logged activity, you’re no longer relying on self-reported data. You can see which reps are working their full territory, which ones are cherry-picking familiar accounts, and which neighborhoods are getting ignored entirely.
Field Sales Analytics vs. Inside Sales Analytics
| Dimension | Inside Sales Analytics | Field Sales Analytics |
|---|---|---|
| Primary data source | CRM + phone system + email | GPS-verified field activity + CRM |
| Key activity metric | Calls/emails per day | Visits per day + territory coverage |
| Efficiency metric | Talk time ratio | Drive time vs. selling time |
| Coverage metric | Accounts contacted | Territory penetration rate |
| Conversion metric | Demo-to-close rate | Visit-to-close ratio |
| Coaching signal | Call recordings | Activity patterns by territory |
The bottom line: if your analytics platform doesn’t understand geography, routes, and physical presence, it’s measuring inside sales metrics for an outside sales team. You’ll get reports, but you won’t get insight.
The 7 Field Sales KPIs That Actually Drive Revenue
Field sales performance analytics starts with the right KPIs — not a spreadsheet of 30 metrics nobody checks, but the 7 numbers that actually tell you whether your team is on track.
We’ve organized these into three tiers: what reps do (activity), how deals move (pipeline), and what the business earns (revenue). For detailed formulas and benchmarks on each of these, see our complete guide to sales performance metrics that improve results.
Activity Metrics — Measuring What Reps Do
- Visits per day: The foundational field sales metric. Not calls — visits. How many face-to-face interactions is each rep completing? Track this daily, not weekly.
- Visit-to-opportunity conversion rate: What percentage of visits create a real pipeline opportunity? A rep averaging 12 visits but converting at 5% needs a different conversation than one averaging 8 visits at 25%.
- Drive time vs. selling time ratio: SPOTIO’s 2026 survey data shows B2C reps spend only 44% of their week selling in person. Every hour behind the wheel is an hour not spent with a customer. Track this to find route optimization opportunities.
Pipeline Metrics — Measuring Deal Progression
- Win rate by territory: Aggregate win rate hides territory-level problems. A team averaging 22% overall might have one territory at 35% and another at 12%. Territory-level win rate tells you where to dig in.
- Average deal velocity: Days from first visit to close. Slowing velocity is an early warning sign — often the first indicator that a rep or territory is in trouble, weeks before it shows up in revenue.
- Pipeline coverage ratio: How much pipeline exists relative to quota? For field sales, a common benchmark is 3x coverage — anything below 2.5x usually signals risk.
Revenue Metrics — Measuring Outcomes
- Revenue per rep / per territory: The outcome metric that matters most. But don’t look at it alone — pair it with activity metrics to understand why one territory outproduces another.
- Quota attainment rate: What percentage of reps are hitting target? SPOTIO’s 2026 survey found that only about a third of field sales organizations have 70% or more of their reps consistently hitting quota. If you’re below that benchmark, your analytics should be focused on finding the gap between your top performers and everyone else.
How to Build a Field Sales Analytics Dashboard
A dashboard is only useful if someone opens it every day. The biggest mistake we see is managers building a 15-widget dashboard that tries to show everything, and then checking it once a month. Here’s a simpler approach.
Step 1 — Pick Your 5–7 Core KPIs
Start with outcomes (revenue per territory, quota attainment) and work backward to the leading indicators that predict them (visits per day, pipeline coverage). Resist the urge to track everything at first. As our customer success team often advises: start with three metrics — visits per day, win rate by territory, and pipeline coverage ratio. Add more only when you’re acting on these three consistently.
Step 2 — Set Up Territory-Level Views
Field sales is a geography business. Your dashboard should default to a territory view, not a company-wide rollup. This lets you spot coverage gaps immediately — which zip codes are getting worked, which ones are dormant, and where reps are overlapping.
With SPOTIO’s performance analytics dashboard, territory views are visual: color-coded maps showing activity density, so you can identify underworked areas at a glance instead of scrolling through spreadsheets.
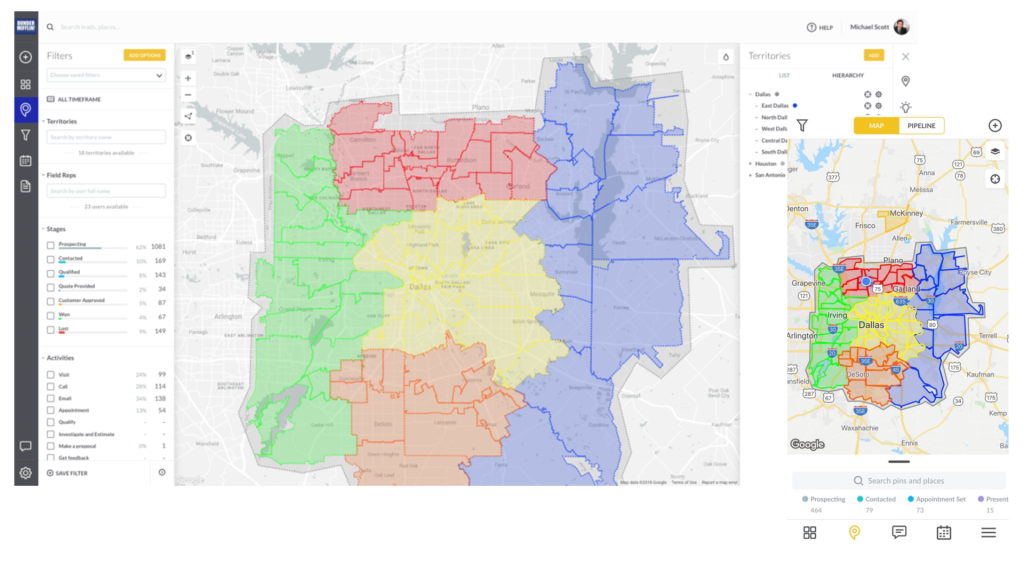
SPOTIO Territory Map on web and mobile.
Step 3 — Automate Your Reports
Manual reporting is where analytics goes to die. Set up automated daily, weekly, and monthly activity reports — daily summaries for reps (their own activity vs. target), weekly rollups for managers (team-level KPIs with territory drill-down), and monthly executive dashboards (revenue trends, pipeline health, forecast accuracy).
The goal: nobody should have to build a report. They should open their phone and see it.
Step 4 — Build Rep-vs-Team Benchmarks
Leaderboards aren’t just motivational — they’re diagnostic. When you can see that Rep A completes 14 visits per day at a 20% conversion rate while Rep B completes 10 visits at 30%, you know exactly what to coach. Rep A needs targeting help. Rep B needs to increase activity volume.
Step 5 — Create a Weekly Analytics Review Cadence
The best field sales managers we work with follow a consistent Monday morning routine: open the dashboard, review territory heatmaps, identify any rep whose visit count dropped more than 20% from the prior week, and schedule a coaching conversation before the team hits the field. The entire review takes 15 minutes. The insight it produces shapes the entire week.
Real-Time Analytics vs. End-of-Day Reporting
If your team still operates on end-of-day reporting — reps log their visits at 6 PM, you review them Tuesday morning — you’re making decisions on stale data. By the time you spot a problem, it’s 24–48 hours old.
The shift to real-time field sales analytics changes three things: forecast accuracy improves because you’re seeing today’s activity as it happens, coaching gets faster because you can address a struggling rep today instead of next week, and pipeline surprises decrease because you’re not waiting for a Friday CRM dump to learn that a territory went dark. The foundation is automating the daily workflows that generate that data — check-ins, follow-ups, and CRM updates — so the analytics feed stays clean without extra effort from reps.
The GPS-Verified Data Advantage
Here’s the fundamental problem with self-reported CRM data: it’s only as accurate as your reps’ willingness to enter it — honestly and on time.
Location-verified activities solve this at the source. When GPS coordinates are attached to every logged activity, the data quality question disappears. A visit is a visit because the rep was physically there. Territory coverage isn’t estimated — it’s measured. And drive time vs. selling time becomes a real metric, not a guess.
This is the difference between analytics built on what reps say they did and analytics built on what they actually did. Every dashboard, every KPI, every coaching conversation becomes more trustworthy when the underlying data is verified.
The numbers bear this out. One mid-market home improvement company saw a 73% increase in verified leads after switching to location-verified activity tracking in SPOTIO — with an 89.4% verification rate across their field team. When the data entering your system is trustworthy by default, more of it converts.
How AI Is Changing Field Sales Analytics
AI in field sales isn’t about replacing reps — it’s about surfacing patterns that humans miss in large datasets.
SPOTIO’s DASH, an AI co-pilot built for field sales teams, summarizes recent account activity so reps can prep for visits in seconds. Reps can use voice input between stops to log notes and update records without pulling over to type — reducing in-car data entry so they stay focused on driving.
Beyond visit prep, SPOTIO’s Next Best Action engine uses Predictive Value Scores trained on your own account’s historical outcomes — not a generic dataset — to recommend the specific next action for every record: visit, call, text, or email. It surfaces the reasoning behind each score so reps and managers understand why a particular account should be prioritized. Recommendations update throughout the day as reps log activity, plus a nightly re-prioritization keeps the next day’s priorities fresh.
The AI trend is accelerating fast. SPOTIO’s 2026 research found that mid-market B2B teams ($25M–$50M revenue) are adopting AI for lead prioritization at 75% — outpacing enterprise firms still constrained by legacy infrastructure. If you haven’t explored how AI layers onto your field analytics, you’re already behind the curve.
Using Analytics to Coach and Scale
The gap between reporting and results is action. The best field sales teams don’t just look at analytics — they have a system for turning data into coaching conversations and territory decisions.
Identifying Underperformers Before It’s Too Late
The warning signs show up in activity data before they show up in revenue. A rep whose visit count drops from 12 per day to 8 is headed for a bad quarter — even if their pipeline looks healthy right now. Declining deal velocity, shrinking territory coverage, and increasing drive-time ratios are all leading indicators that something is off.
The analytics-to-coaching workflow looks like this: spot the pattern in the dashboard → drill into the territory to understand the why → have a 1:1 coaching conversation anchored in specific data, not general impressions. “Your visits dropped 30% in the Heights territory last week — what happened?” is a fundamentally different conversation than “You need to pick up the pace.”
Scaling What Works Across Territories
Analytics isn’t just for fixing problems — it’s for replicating success. When one territory consistently outperforms on visit-to-close ratio, the question is: what’s different? Is it the rep’s approach, the territory composition, the account mix, or the visit cadence?
Once you identify the pattern, you can replicate it. Reassign territory boundaries based on performance data. Adjust coverage models using actual drive-time calculations. Pair underperforming reps with top performers in adjacent territories for ride-alongs that are targeted, not random.
Advocate Construction is a good example. After their managers started using SPOTIO’s analytics to identify and replicate what top reps were doing differently, the home improvement company saw a 300% year-over-year increase in total wins — and a 263% increase in wins per rep. That’s not a story about hiring more people. It’s a story about using data to scale what was already working.
The organizations seeing real results from field analytics are building a feedback loop where data drives coaching, coaching drives behavior change, and behavior change drives revenue. SPOTIO’s 2026 State of Field Sales data found that 73% of surveyed field sales organizations grew revenue; but only about one in five achieved what the report calls “Sustainable Success,” the combination of hitting quota targets and maintaining a stable sales force. Analytics is how you bridge that gap.
Choosing the Right Field Sales Analytics Platform
Not every analytics tool is built for teams that sell in the field. Before evaluating platforms, make sure you’re asking field-specific questions, not just checking generic software boxes.
Platform Evaluation Checklist
- Field-specific KPIs: Does the platform track visits, territory coverage, and drive time — or just calls and emails?
- Location-verified data: Can the platform attach GPS coordinates to logged activities, or does it rely on self-reported data?
- Mobile-first design: Is the analytics experience built for a phone screen in a truck, or does it only work well on a desktop?
- Territory visualization: Can managers see territory heatmaps and coverage maps, or just tables and charts?
- CRM integration: Does the platform offer real-time, bi-directional sync with your existing CRM?
- AI and predictive capabilities: Does it surface recommended next actions based on your team’s own data patterns?
- Ease of adoption: Will your reps actually use it without weeks of training? SPOTIO’s platform is designed so reps can log field activities with one tap — because the best analytics platform in the world is useless if nobody enters data into it.
See how SPOTIO’s analytics dashboard handles each of these for field sales teams. For more on evaluation criteria, explore our sales performance management tools roundup, or dive into our complete field sales KPI guide for a deeper look at what to measure.
Frequently Asked Questions
Field sales performance analytics is the practice of collecting, measuring, and acting on data from reps who sell face-to-face in the field. Unlike generic sales analytics, it incorporates field-specific dimensions — GPS-verified visit data, territory coverage metrics, drive time vs. selling time, and route efficiency — to give managers accurate visibility into what’s actually happening in every territory.
Focus on seven core KPIs across three tiers: activity metrics (visits per day, visit-to-opportunity conversion, drive time vs. selling time), pipeline metrics (win rate by territory, deal velocity, pipeline coverage ratio), and revenue metrics (revenue per rep and quota attainment). Start with three and add more as your team consistently acts on the data.
CRM reporting captures what reps type into the system — often hours after the fact, with no verification. Field sales analytics captures location-verified activities with GPS coordinates, measures territory coverage geographically, and tracks field-specific metrics like visit density and route efficiency that CRMs weren’t designed to handle.
AI analyzes patterns across your team’s historical field data to surface insights humans would miss. This includes predictive value scores that prioritize which accounts to visit next, visit prep summaries that get reps ready in seconds, and voice-to-CRM capabilities that let reps update records between stops without typing. The key: AI recommends actions, but reps confirm before anything is executed.
Track three metrics before and after implementation: selling time as a percentage of total work hours (aim to reclaim at least 5 percentage points from admin work), territory coverage rate (percentage of assigned accounts receiving visits within your target cadence), and pipeline-to-quota ratio. SPOTIO’s 2026 survey data suggests that shifting just 5 percentage points from admin to selling creates roughly 12% more selling capacity — without adding headcount.
See how SPOTIO gives field sales managers real-time visibility into every territory, every rep, and every KPI — without the spreadsheet juggling. Request a demo →

Scott Shapiro is President of SPOTIO and a seasoned sales and revenue leader with more than two decades of experience scaling high-performance sales organizations. Before joining SPOTIO as Chief Revenue Officer, he held CRO roles at PowerDMS and Igloo Software, and spent nearly 11 years at Paycor progressing from Area Sales VP to VP of Sales. A 9-time President's Club qualifier — recognized as the top sales executive or leader in his organization 6 of those years — Scott brings deep expertise in sales management, revenue operations, and go-to-market strategy. He holds an MBA from the University of Notre Dame and a B.S. from the University of Cincinnati.
Research and drafting assisted by AI tools; all content is reviewed, fact-checked, and approved by Scott and the SPOTIO editorial team.